Running Weather Research Forecast as a Service on Windows Azure
About 9 months ago, I deployed a Weather forecast demo at an internal Microsoft event, Techfest. The demo uses real data from NOAA and predicts high resolution weather forecast up to the next 3 days running a HPC modeling code called WRF. Since then, I’ve received a great deal of interest from others, and we’ve renovated the site with a new design. Before long, this became a more permanent service that is used by me and many others as a Windows Azure “Big Compute” demo at many events such as TechEd, BUILD, and most recently at SuperComputing 2012. Someone recently reminded me of the dramatic thunder rolling in live at TechED in Orlando as I demoed the service predicting rain coming. I am also aware that many of my colleagues have been using it for their own travel and events. The service now has over 8 million objects and estimated 5 TB worth of simulation data saved, it is starting to look more like a Big Data demo.
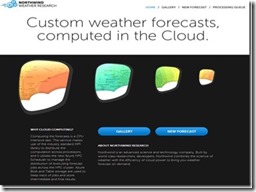
The service is available at https://weatherservice.cloudapp.net, whose home page is shown above. I’ve been frequently asked about the technical details on this, so here is a brief explanation. The service makes use of the industry standard MPI library to distribute the computations across processors. It utilizes a Platform as a Service (PaaS) version of Windows Azure HPC Scheduler to manage the distribution and executing forecast jobs across the HPC cluster created on Windows Azure. To keep this simple, Azure Blob and Table storage are used to keep track of jobs and store intermediate and final results. This loosely-coupled design allows Jobs/work to be done by on-premise super computers to post their results just as easily as Windows Azure Compute nodes. Since regular Azure nodes are connected via GigE, we’ve decided to run forecast jobs on only one X-Large instance, but things will soon change as the new Windows Azure Hardware becomes available. A Demo Script walk-through is now available on GitHub.
Weather forecasts are generated with the Weather Research and Forecasting (WRF) Model, a mesoscale numerical weather prediction framework designed for operational forecasting and atmospheric research needs. The overall forecast processing workflow includes preprocessing of inputs, geographical coordinates, duration of forecast, to WRF, generation of the forecast results, and post-processing of the results and formattting them for display. The workflow is wrapped into a 1000 line PowerShell script, and run as an HPC Job.
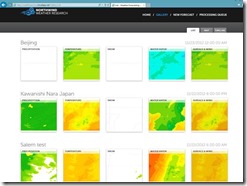
The demo web service contains an agent that performs computations for a weather forecast in a geographic area of roughly 180 square kilometers(Plotted). The area is treated as a single unit of work and scaled out to multiple machines (cores in the case of Windows Azure) forecasting precipitation, temperature, snow, water vapor and wind temperature. A user can create a new forecast by simply positioning the agent on the map. The front-end will then monitor the forecast’s progress. The front-end consists of an ASP.NET MVC website that allows users to schedule new forecast job, view all forecast jobs as a list, view the details of forecast job, display single forecast job results, and display all forecast job results in a visual gallery, on the map or as timeline.
After a forecast computation is completed, intermediate results are converted to a set of images (animation) for every two hours of the forecast’s evolution. These flat images are processed into Bing Map Tiles, using specialized software that geo-tags the images, warps them to Bing Map projection, and generates sets of tiles for various map zoom levels.
Processing Summary
Pre-Processing of Forecast Data
There are two categories of input data to the WRF forecast software: geographical data and time-sensitive, low resolution forecast data used as initial and boundary condition data for the WRF software. The geographical data changes very little over time and hence is considered static for forecast purposes. The low resolution forecast data, however, is updated by NOAA every 6 hours and so must be retrieved on a regular basis via ftp to Azure resources. Schtasks.exe was good enough for what we needed. The preparation of geographical and low resolution forecast data are done by a set of programs within a framework called WPS, which stands for WRF Preprocessing System. WPS is used to prepare a domain (region of the Earth) for WRF. The main programs in WPS are geogrid.exe, ungrib.exe and metgrid.exe. The principal tasks of each program are as follows:
Geogrid:
- Defines the model horizontal domain
- Horizontally interpolates static data to the model domain
- Output conforms to the WRF I/O API
Ungrib:
- Decodes Grib Edition 1 and 2 data (Grib is the file format of the NOAA forecast data)
- Uses tables to decide which variables to extract from the data
- Supports isobaric and generalized vertical coordinates
- Output is in a non-WRF-I/O-API form, referred to as an intermediate format
Metgrid:
- Ingest static data and raw meteorological fields
- Horizontally interpolate meteorological fields to the model domain
- Output conforms to WRF I/O API
The WRF Preprocessing System (WPS) is the set of three programs whose collective role is to prepare input to the real.exe program for real-data simulations. Each of the three programs described above performs one stage of the preparation and is linked to the other programs as shown in Figure 1. Input to the programs is through the namelist file "namelist.wps". Each main program has an exclusive namelist record (named "geogrid", "ungrib", or "metgrid", respectively), and the three programs have a group record (named "share") that each program reads.
Figure 1. The data flow between the programs of the WPS.
Forecast Generation
- Real.exe is the initialization module for WRF for “real” input data to WRF. It uses the data generated by the routines above. Configuration parameters are provided in the file ‘namelist.input’.
- WRF generates the final forecast results. The output from WRF is then geo-referenced, re-projected and tiled for display on Bing Maps and as movie forecast histories in the demo web service. This is the longest running part of the process, it takes 5-6 hours to complete using 1 instance of the current standard X-Large VM with 8 CPU cores. Windows version of the code is built using PGI compiler, since then we have built MINGW64 bits, as well as Intel FORTRAN versions.
- Forecasts for the Azure demo are generated over a 180 km x 180 km region of the Earth using a nested grid geometry determined to be an optimal balance between forecast resolution and computational complexity. The outermost grid has a node spacing of 9 km and covers a horizontal area of 540km x 540km. Within this grid is another grid with 3 km node spacing (3:1 increased spatial resolution within the outmost grid) that covers a 180km x 180km region. Within this grid is a second increased resolution grid that covers 60km x 60km. While computations are performed over all grids by necessity to match boundary conditions, output is only stored for the middle grid since it provides sufficient resolution for the web demo.
Post-Processing of Forecast Results
Each forecast output is written as a png file at each time step. Each file is then geo-referenced, that is, selected pixel values in the image must be labeled with a specific latitude/longitude pair. Then each file is geographically re-projected so that it overlays properly on Bing Maps. Lastly, the re-projected file must be divided into a set of smaller image files, or tiles, to support the zoom/pan capabilities of Bing Maps and other AJAX-based web mapping platforms.
These post-processing steps are accomplished with three programs from the GDAL open source geospatial library (www.gdal.org), as follows:
- Gdal_translate:
- Converts file from png to geospatial Tiff (geoTiff) format
- Assigns geo-referencing (“ground control points”) to specified pixel values
- Labels the output (geoTiff) file’s header with map projection information
- Gdalwarp:
- Geographically reprojects the output file from gdal_translate to the map projection of Bing Maps
- Gdal2tiles.py:
- A python script that generates tiles from the output file from gdalwarp
- Zoom levels are specified on the command line
You can find out more details on each of these steps through the detailed logs and “show logs” page we provide for each of the simulation runs.
Conclusion
With Microsoft Windows Azure PaaS, we’ve simplified the task of providing compute resources to complex compute intensive software, a task that previously would have required expensive hardware and domain specialists. Using an extra-large 8-core instance for the computation, the simulation takes about hours for all the steps. Since WRF uses Message Passing library (MPI) for parallelism, it can easily scale multiple HPC capable machines with fast interconnects.
As we make new HPC hardware available in Windows Azure, more cores can be applied simultaneously to one simulation run and it should easily reduce the run time down to minutes from 5-6 pure computation hours without any modification to the code. The compute cost comes down to about a few dollars per simulation, it is something that just about anyone can do and afford.
Complex software systems can be moved online using off-the-shelf Microsoft web software and robust pay-as-you-go cloud technologies to reach the masses. We can see this enables a new paradigm of collaborative research and knowledge sharing. In the near future, weather forecasts will be used to plan and operate search & rescue missions and wind farms. They will shape hurricane preparation timetables and financial assessments of weather-related damages, helping businesses and communities remove and manage risks and unknowns posed by nature.


