Virtual code execution via IL interpretation
As Soma announced, we just shipped VS2010 Beta1. This includes dump debugging support for managed code and a very cool bonus feature tucked in there that I’ll blog about today.
Dump-debugging (aka post-mortem debugging) is very useful and a long-requested feature for managed code. The downside is that with a dump-file, you don’t have a live process anymore, and so property-evaluation won’t work. That’s because property evaluation is implemented by hijacking a thread in the debuggee to run the function of interest, commonly a ToString() or property-getter. There’s no live thread to hijack in post-mortem debugging.
We have a mitigation for that in VS2010. In addition to loading the dump file, we can also interpret the IL opcodes of the function and simulate execution to show the results in the debugger.
Here, I’ll just blog about the end-user experience and some top-level points. I’ll save the technical drill down for future blogs.
Consider the following sample:
 using System;
using System.Collections.Generic;
using System.Linq;
using System.Text;
using System.Reflection;

public class Point
{
    int m_x;
    int m_y;
    public Point(int x, int y)
    {
        m_x = x;
        m_y = y;
    }
    public override string ToString()
    {
        return String.Format("({0},{1})", this.X, this.Y);
    }

    public int X
    {
        get
        {
            return m_x;
        }
    }
    public int Y
    {
        get
        {
            return m_y;
        }
    }
}

public class Program
{
    static void Main(string[] args)
    {
        Dictionary<int, string> dict = new Dictionary<int, string>();
        dict[5] = "Five";
        dict[3] = "three";

        Point p = new Point(3, 4);

    }

    public static int  Dot(Point p1, Point p2)
    {
        int r2 = p1.X * p2.X + p1.Y * p2.Y;
        return r2;
    }

}
Suppose you have a dump-file from a thread stopped at the end of Main() (See newly added menu item “Debug | Save Dump As …”; load dump-file via “File | Open | File …”).
Normally, you could see the locals (dict, p) and their raw fields, but you wouldn’t be able to see the properties or ToString() values. So it would look something like this:
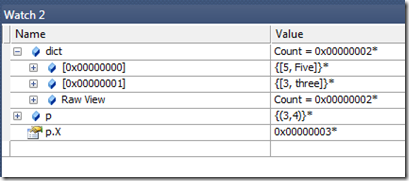
But with the interpreter, you can actually simulate execution. With the IL interpreter, here’s what it looks like in the watch window:
Which is exactly what you’d expect with live-debugging. (In one sense, “everything still works like it worked before” is not a gratifying demo…)
The ‘*’ after the values are indications that they came from the interpreter. Note you still need to ensure that property-evaluation is enabled in “Tools | options | Debugging”:
How does it work?
The Interpreter gets the raw IL opcodes via ICorDebug and then simulates execution of those opcodes. For example, when you inspect “p.X” in the watch window, the debugger can get the raw IL opcodes:
.method public hidebysig specialname instance int32
get_X() cil managed
{
// Code size 12 (0xc)
.maxstack 1
.locals init ([0] int32 CS$1$0000)
IL_0000: nop
IL_0001: ldarg.0
IL_0002: ldfld int32 Point::m_x
IL_0007: stloc.0
IL_0008: br.s IL_000a
IL_000a: ldloc.0
IL_000b: ret
} // end of method Point::get_X
And then translate that ldfld opcode into a ICorDebug field fetch the same way it would fetch “p.m_x”. The problem gets a lot harder then that (eg, how does it interpret a newobj instruction?) but that’s the basic idea.
Other things it can interpret:
The immediate window is also wired up to use the interpreter when dump-debugging. Here are some sample things that work. Again, note the ‘*’ means the results are in the interpreter and the debuggee is not modified.
Simulating new objects:
? new Point(10,12).ToString()
"(10,12)"*
Basic reflection:
? typeof(Point).FullName
"Point"*
Dynamic method invocation:
? typeof(Point).GetMethod("get_X").Invoke(new Point(6,7), null)
0x00000006*
Calling functions, and even mixing debuggee data (the local variable ‘p’) with interpreter generated data (via the ‘new’ expression):
? Dot(p,new Point(10,20))
110*
It even works for Visualizers
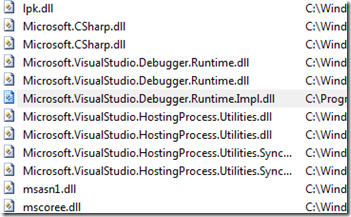
Notice that it can even load the Visualizer for the Dictionary (dict) and show you the contents as a pretty array view rather than just the raw view of buckets. Visualizers are their own dll, and we can verify that the dll is not actually loaded into the debuggee. For example, the Dictionary visualizer dll is Microsoft.VisualStudio.DebuggerVisualizers.dll, but that’s not in the module list:
That’s because the interpreter has virtualized loading the visualizer dll into its own “virtual interpreter” space and not the actual debuggee process space. That’s important because in a dump file, you can’t load a visualizer dll post-mortem.
Other issues:
There are lots of other details here that I’m skipping over, like:
- The interpreter is definitely not bullet proof. If it sees something it can’t interpreter (like a pinvoke or dangerous code), then it simply aborts the interpretation attempt.
- The intepreter is recursive, so it can handle functions that call other functions. (Notice that ToString call get_X.)
- How does it deal with side-effecting operations?
- How does it handle virtual dispatch call opcodes?
- How does it handle ecalls?
- How does it handle reflection
Other advantages?
There are other advantages of IL interpretation for function evaluation, mainly that it addresses the ”func-eval is evil” problems by essentially degenerating dangerous func-evals to safe field accesses.
- It is provably safe because it errs on the side of safety. The interpreter is completely non-invasive (it operates on a dump-file!).
- No accidentally executing dangerous code.
- Side-effect free func-evals. This is a natural consequence of it being non-invasive.
- Bullet proof func-eval abort.
- Bullet proof protection against recursive properties that stack-overflow.
- It allows func-eval to occur at places previously impossible, such as in dump-files, when the thread is in native code, retail code, or places where there is no thread to hijack.
Closing thoughts
We realize that the interpreter is definitely not perfect. That’s part of why we choose to have it active in dump-files but not replace func-eval in regular execution. For dump-file scenarios, it took something that would have been completely broken and made many things work.
Comments
Anonymous
May 21, 2009
How far does it go? For example, you've clearly are intepreting the String.Format in the ToString - do you walk into the body of String.Format (and hence StringBuilder.AppendFormat) or do you recognize the pattern and then fill in the blanks?Anonymous
May 21, 2009
The comment has been removedAnonymous
May 21, 2009
Does this mean that for regular debugging, if a thread is in a Wait-state or in a native frame, that we'll now be able to see property values?Anonymous
May 22, 2009
The comment has been removedAnonymous
May 23, 2009
Good stuff... We're doing more and more mixed-mode debugging these days... If this ever gets to where it can be used to make that half-way reliable, i'll be pushing for an upgrade!Anonymous
May 25, 2009
This is really a cool thing! I'll try this out in the Beta. Is this implemented as part of the ICorDebugEval Interface or is this VS stuff? So do own Debuggers based on ICorDebug (like MDBG) also have this feature implemented? Thank you!Anonymous
May 26, 2009
Shog9 - This can help Interop debugging in 2 ways:
- It allows managed evaluation even when the thread is in native code. (which would be a more common case in interop-debugging)
- It avoids a real funceval, which is dangerous, especially in interop-debugging scenarios. However, we haven't yet activated it for live cases, so these benefits aren't realized in the beta. GP - The interpreter is layered on top of ICorDebug. So ICorDebugEval still does a real func-eval (which is sometimes useful if you actually want to modify the process, hit a nested break, etc). The debugger decides whether to use a real eval or the interpreter. The interpreter doesn't ship with Mdbg. Ironically, we actually began prototyping the interpreter inside of Mdbg, and then moved it into VS for production.
- Anonymous
June 16, 2009
Interesting and potentially useful ... but a far more beneficial use of your (CLR team) time would be to add the debugging feature of Edit and Continue for the x64 CLR. Not having that for the past year has caused the x64 capable release of our product to slip by many months, and it certains adds a large amount of time to new development on x64. Yes I know I can mark the project as targeting x86, and beleive me we do, but some things are just different and cause subtle bugs that take a lot of time to trace ... {rant could continue} We were all told it would take too long to make it into VS2005, then it just didn't happen for VS2008 without comment, and now I find it still isn't in the VS2010 Beta! So, please please please, raise the priority of x64 Edit and Continue!!!


