Getting started with Exchange 2007 Performance monitoring and Windows 2008
With all the moving bells and whistles of Exchange 2007 and the amount of dependencies that Exchange relies on, it could be a bit overwhelming on where to get started. For some, they may have their own monitoring tools such as MOM/SCOM to pull this data, but when you are in a real-time crisis or something that affecting critical business functions over time, finding out where to start can lead one in to frustration.
Well, never fear, I'll help guide you in to looking at the server from the 30,000 ft view and then delve deeper in to the plethora of pertinent counters to look at. So where do I get started?
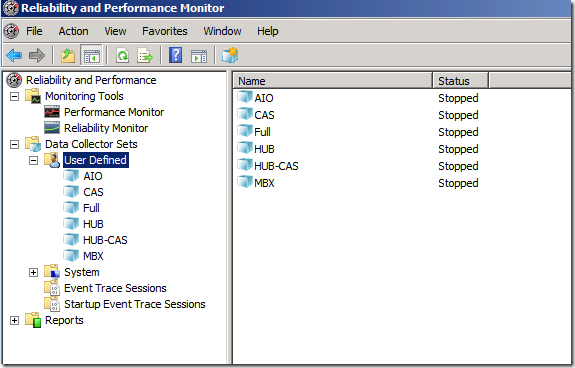
We could start off with a once upon the time story or 10 ways to lick an Exchange performance problem in the bud, but lets start with the simple basics. First, you will need to start some monitoring on your server to start collecting the data. I've made this quite easy for you as I have created templates for you that are very easily importable in to the Reliability and Performance monitor in Windows 2008. I'll be concentrating on Windows 2008 analysis in this blog as that is the wave of the future. Go to https://blogs.technet.com/mikelag/archive/2008/05/02/perfwiz-replacement-for-exchange-2007.aspx to find the templates for your particular role installation. Once you have imported your favorite XML file, you will get a screen similar to the following. Simply right-click on your imported counter set and click start. Let this run through the problem time in which you are trying to troubleshoot. Note: I have imported all of the XML files here to get started.
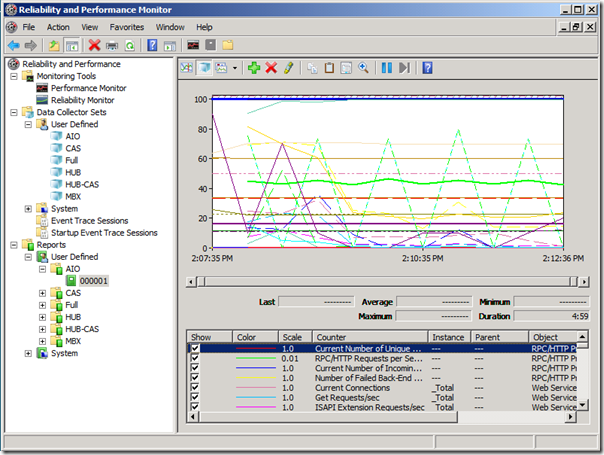
Once you have collected enough data, you can stop the Performance log. From there, you can then expand reports in the menu and then click on the report associated with the log that you just ran. You will get a screen similar to the following. The really cool thing about Windows 2008 is that if you should double-click on a performance file (.blg) or open this report view, you will get all counters added automatically with all Totals listed for each counter. Trying to load all counters/all instances would take a substantial amount of time to load, so I feel this is the best place to begin your troubleshooting. This is what I call the 30,000 ft view. Loading this type of view is normally very fast to load and provides you a wealth of information right at your fingertips.
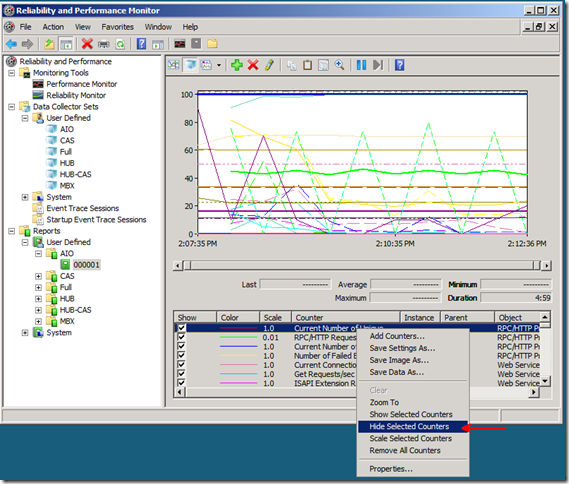
What you will want to do is to compare each of the counters with the threshold values that are listed in the Technet article Monitoring Without System Center Operations Manager. If any counters are deemed suspect, I would put them on your list of things to delve deeper in to. Once you go through all of these counters, you could see if there is anything that stands out which will give you something to concentrate on. Counters that you no longer want to see can be easily hidden as shown below or by simply un-checking the box in the Show column of each counter
Now, since we are only showing totals at this point, you may need to jump off the diving board and dive right in to specific instances of a counter in which a threshold is above normal. Simply click the Plus  sign on the menu and then add the counters of your choice.
That is basically all there is too it in getting started, but there are other ways of getting to root cause of a complex issue. Read on...
If you have collected a .blg file already, you can parse all of the data automatically via the Performance Analyzer Log tool. See my previous blog on how to use this most helpful tool here
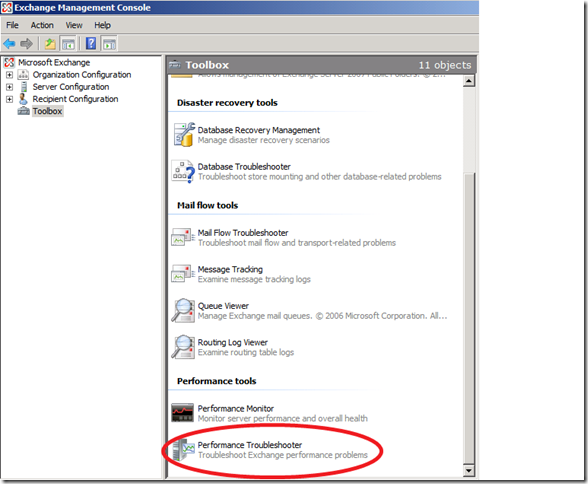
Another way to troubleshoot Exchange Performance can be had in the Exchange Management Console Toolbox as shown below via the Performance Troubleshooter. This can also be very helpful in troubleshooting these issues as this tool has some built in tracing mechanisms that allow you to peer in to some of the Exchange processes in which you cannot get to by any normal logging or tracing means without PSS involved.
I'll be posting most of these type posts coming in the future, so keep a watch on my blog.
Mike
Comments
- Anonymous
January 01, 2003
The comment has been removed - Anonymous
August 02, 2011
I had/have no knowledge in Perfmon... Your blogs are helping me get some insight to start with and your explainations is very basic and simple to understand. Thanks for blogging and I will sure keep following your blogs... :)


