Improved PAL analysis for Exchange 2007
I wanted to write a post regarding a lot of work that has gone into updating the Exchange Server 2007 PAL xml threshold files in order to make them more relevant and to more accurately report on Exchange Performance problems. This update couldn’t have been done without the help from Chris Antonakis who was one of the major contributors to all of these updates. Kudos to Chris on this one.
There are some major updates that you need to be aware of when running the PAL tool to analyze Exchange performance problems and the Mailbox Role was the biggest change on how to look at things.
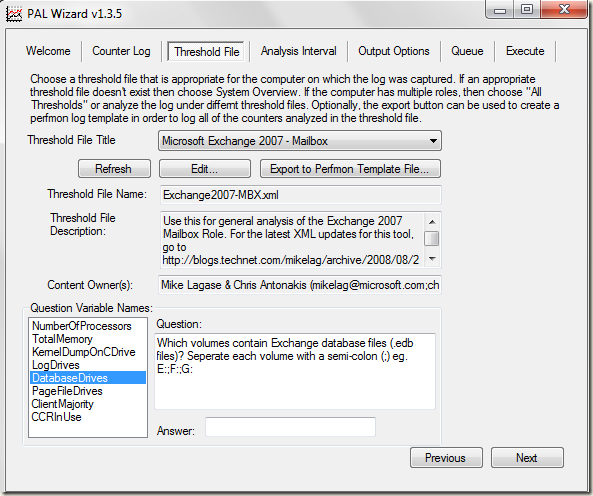
Shown below is the selection for the Mailbox Role threshold file which includes a few new questions. These questions will help break down performance problems specific to database drives, log file drives and pagefile drives in the resultant report. Previously, this was an all encompassing generic analysis which didn’t really give you the full picture of actual bottlenecks as there are latency differences between the database and log file drives.
Adding Database Drive letters is quite easy, and gathering the data for this input can be collected from various areas such as ExBPA and in the BLG file itself. These drive letters could also include Volume Mount Points.
If you know the drive letters already, then that is great. Let’s say your database drives were on Drive E:, Drive F:, and Drive G:, you would need to enter them separated by a semicolon such as E:;F:;G: as shown in the screenshot above. You would also need to do this for the Log File Drives and the Page File Drives for a more accurate analysiss
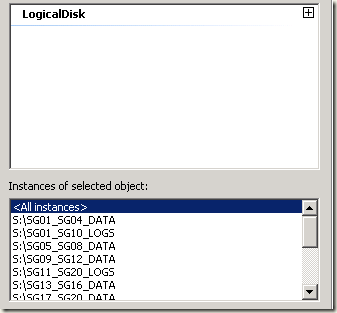
Using an ExBPA report of the server and the Tree Report view would be the best way to get the drive letter and volume mount point information, but sometimes a BLG file may provide enough information regarding volume mount points based on the naming convention that was used (keep in mind though that although the volume mount point is named “<Drive Letter:>\Logs” it may actually contain database files or no files at all). A screenshot below shows the Logical Disk counter that shows the volume mount point names. Unfortunately we don’t have a scripted way to pull the data out of the blg file at this time, so this is a manual process.
For the above information, assuming all the _DATA volume mount points contained Exchange databases, you would start entering data in the question as the following:
S:\SG01_SG04_DATA;S:\SG05_SG08_DATA;S:\SG09_SG12_DATA
You get the idea… Just remember that all drives and mount points need to be separated by a semicolon and you should be good.
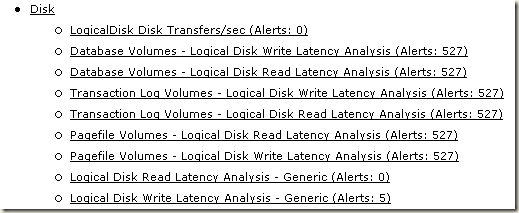
Now it’s important to note that we have included a catch all Generic Disk analysis for incase any of the drive questions were not answered. So, if you ran a report and forgot to enter any drive information in, you will get an output similar to the following in the Table of Contents. This may lean you towards an actual disk related problem due to the amount of times an analysis crossed over a threshold. You will see that there were 527 disk samples taken in this perfmon and all Database, Log and Page file drives have the same alert count in them. It is actually normal that this is happening because we will now log a tripped threshold for each drive type specific analysis and have fallen through to the Generic Disk analysis. If you see this, then go directly to the Generic analysis to look at your disk analysis.
For each one of the thresholds that tripped in which drive letters were not entered, you will see an entry in the table similar to the following stating that no data was entered in the questions. You can either ignore this and view the Generic Disk analysis or re-run the analysis with the questions correctly answered, providing a more accurate analysis.
The same holds true for the Hub Transport and Client Access server disk analysis.
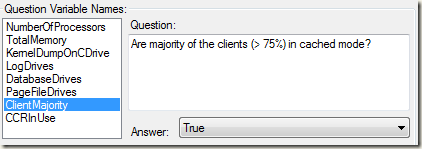
Another question that was added to the Mailbox server role analysis was ClientMajority which specifies if the majority of the clients are running in cached mode or not. This setting directly affects the analysis of the MSExchange Database(Information Store)\Database Cache % Hit counter.
Database Cache % Hit is the percentage of database file page requests that were fulfilled by the database cache without causing a file operation, i.e. not having to read the Exchange database to retrieve the page. If this percentage is too low, the database cache size may be too small.
Here are the thresholds that were added for this particular analysis.
- WARNING - Checks to see if majority of the clients are in Online Mode and if the Database Cache Hit % is less than 90%
- ERROR - Checks to see if majority of the clients are in Online Mode and if the Database Cache Hit % is less than 75%
- WARNING - Checks to see if majority of the clients are in Cached Mode and if the Database Cache Hit % is less than 99%
- ERROR - Checks to see if majority of the clients are in Cached Mode and if the Database Cache Hit % is less than 85%
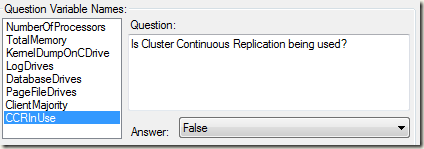
The last question that was added was CCRInUse. This question helps differentiate analysis for CopyQueueLength and ReplayQueueLength between CCR and LCR replication since we have different recommended values for each configuration.
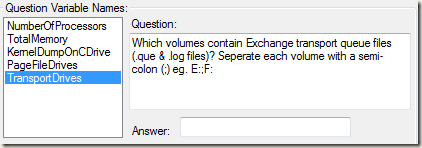
There was also an update for the HUB and HUB/CAS role threshold files where you can now specify drive information for both the Exchange Transport queue file drives and the Page File Drives.
Additionally the 64bit question was removed from all the Exchange Server 2007 PAL threshold files, since Exchange 2007 is only supported in production on a 64bit Windows operating system.
It’s probably also important to point out that we’ve managed to get all of the thresholds corrected and updated and a number of new analysis rules added however we haven’t necessarily managed to update or include all of the associated rule and troubleshooting text that goes with each analysis rule. As we get some more time these will be updated, for now it will be more important to migrate all the PAL 1.0 Exchange content to the new PAL 2.0 that will be available sometime in the near future.
To download the latest XML files, go the XML update page here or direct download here
If you are interested in the other changes that were made to the 3 threshold files here they are below:
MBX:
- Change RPC slow packets (>2s) more than 0 to only trigger on average value as per online documentation.
- Updated RPC Average Latency to warn on 25ms average (as per online guidance), warn on 50ms max and critical on 70ms max or average.
- Added MSExchangeIS\RPC Client Backoff/sec to warn on greater than 5.
- Modified MSExchangeIS Client: RPCs Failed: Server Too Busy to only create a warning for greater than 50 and removed the error alert for greater than 10 seeing as this counter is mostly useful to know if Server Too Busy RPC errors have ever occurred (since it is calculated since store startup)
- Modified MSExchangeIS\RPC Requests to warn on 50 instead of 70 as higher than 50 is already too high and to then error on 70.
- Removed the MSExchangeWS\Request/Sec counter from Web Related as MSExchangeWS does not exist on a MBX server.
- Added _Total to instance exclusions for disk analysis.
- Added _Total to instance exclusions for MSExchange Search Indices counters.
- Added _Total to instance exclusions for various other counters.
- Created a generic disk analysis for when either the log drives, database drives or pagefile drives is unknown.
- Added in a warning alert threshold for Calendar Attendant Requests Failed when it is greater than 0.
- Removed the System process exclusion for Process(*)\% Processor Utilization analysis as we do want to know if this is using excessive amounts of CPU as it can indicate a hardware issue
- Configured the Privileged Mode CPU Analysis to work on _Total instead of individual processors.
- Updated the Privileged Mode CPU Analysis to not continue if the Total Processor Time is not greater than 0, previously it did not continue if the Privileged Mode Time was not greater than 0. This meant we could get a divide by 0.
- Updated the Privileged Mode CPU Analysis to warn on greater than 50% of total CPU and Total CPU is between 20 and 50
- Added a warning alert for Processor\% User Time to fire if % User Time is greater than 75% as per online guidance.
- Corrected Memory\Pages/Sec text of "Spike in pages/sec - greater than 1000" to read "greater than 5000"
- Added IPv4\Datagrams/sec and IPv6\Datagrams/sec
- Added TCPv4\Connection Failures and TCPv6\Connection Failures
- Added TCPv4\Connections Established and TCPv6\Connections Established
- Added TCPv4\Connections Reset and TCPv6\Connections Reset and set a threshold for both to warn on an increasing trend of 30
- Added TCPv4\Segments Received/sec and TCPv6\Segments Received/sec
- Updated MSExchange Database(Information Store)\Version buckets allocated to alert on greater than 11468 instead of 12000 i.e. 70% of 16384.
- Collapsed all MSExchange ADAccess counters under MSExchange ADAccess category
- Added _Global_ as an exclusion to .Net Related\Memory Leak Detection in .Net
- Added _Global_ as an exclusion to .Net Related\.NET CLR Exceptions / Second
- Updated .Net Related\.NET CLR Exceptions / Second to warn on greater than 100 exceptions per second.
- Moved Process(*)\IO Data Operations/sec into an IO Operations category as it is not just disk related
- Moved Process(*)\IO Other Operations/sec into an IO Operations category as it is not just disk related
- Updated Network Packets Outbound Errors to alert on greater than 0 instead of 1
- Updated Network Utilization Analysis to error on greater than 70%
- Updated Memory\Page Reads/Sec to only warn on 100 average instead of 100 max, other thresholds of 1000 and 10000 still remain the same
- Updated Memory\Pages Input/Sec's warning to read "More than 1000 pages read per second on average"
- Updated Memory\Pages Input/Sec to not warn on max of 1000 (it is too low to warn on 1000 max)
- Updated Memory\Pages Output/Sec's warning to read "More than 1000 pages written per second on average"
- Updated Memory\Pages Output/Sec to not warn on max of 1000 (it is too low to warn on 1000 max)
- Added a content indexing section for the Exchange 2007 indexing counters
- Added analysis for ExSearch processor usage to warn on more than 1% and error on more than 5%
- Added analysis for MSFTEFD* processor usage to warn on using more than 10% of the Store.exe processor usage
- Updated .Net CLR Memory\% Time in GC to include * for process and exclude _Global. Removed 5% threshold and made 10 and 20% threshold warning and error conditions respectively.
- Updated MSExchange Replication\ReplayQueueLength and CopyQueueLength Counters to exclude _Total
- Modified MSExchange ADAccess Processes(*)\LDAP Search Time to warn on over 50 average and 100 max and critical on over 100 average and 500 max
- Added threshold alerts for MSExchange ADAccess Processes(*)\LDAP Read Time
- Added threshold alerts for MSExchange ADAccess Domain Controllers(*)\LDAP Read Time
- Modified MSExchange ADAccess Domain Controllers(*)\LDAP Search Time to warn on over 50 average and 100 max and critical on over 100 average and 500 max and only if number of Search Calls/Sec is greater than 1
- Added MSExchange Store Interface(*)\ConnectionCache out of limit creations and MSExchange Store Interface(*)\ConnectionCache active connections counters and thresholds
HUB:
Removed the System process exclusion for Process(*)\% Processor Utilization analysis as we do want to know if this is using excessive amounts of CPU as it can indicate a hardware issue
Configured the Privileged Mode CPU Analysis to work on _Total instead of individual processors.
Updated the Privileged Mode CPU Analysis to not continue if the Total Processor Time is not greater than 0, previously it did not continue if the Privileged Mode Time was not greater than 0. This meant we could get a divide by 0.
Updated the Privileged Mode CPU Analysis to warn on greater than 50% of total CPU and Total CPU is between 20 and 50
Added a warning alert for Processor\% User Time to fire if % User Time is greater than 75% as per online guidance.
Removed Process\%Processor Time from the Process category as it is already included as part of Processor\Excessive Processor Use By Process
Modified Memory\Available MBytes to warn on less than 100MB and critical on less than 50MB
Added threshold alerts for Memory\% Committed Bytes in Use to warn on greater than 85% and critical on more than 90%
Added Memory\Committed Bytes
Corrected Memory\Pages Input/Sec to warn on greater than 1000 as it was set to warn on greater than 10
Added threshold alert for Memory\Pages Output/Sec to warn on greater than 1000
Corrected Memory\Pages/Sec text of "Spike in pages/sec - greater than 1000" to read "greater than 5000"
Modified Memory\Transition Pages Repurposed/Sec to warn on spikes greater than 1000 instead of 100
Modified Memory\Transition Pages Repurposed/Sec to critical on averages greater than 500 instead of 1000
Modified Memory\Transition Pages Repurposed/Sec to critical on spikes greater than 3000 instead of 1000
Added IPv4\Datagrams/sec and IPv6\Datagrams/sec
Added TCPv4\Connection Failures and TCPv6\Connection Failures
Added TCPv4\Connections Established and TCPv6\Connections Established
Added TCPv4\Connections Reset and TCPv6\Connections Reset and set a threshold for both to warn on an increasing trend of 30
Added TCPv4\Segments Received/sec and TCPv6\Segments Received/sec
Modified MSExchange ADAccess Processes(*)\LDAP Search Time to warn on over 50 average and 100 max and critical on over 100 average and 500 max
Added threshold alerts for MSExchange ADAccess Processes(*)\LDAP Read Time
Added threshold alerts for MSExchange ADAccess Domain Controllers(*)\LDAP Read Time
Modified MSExchange ADAccess Domain Controllers(*)\LDAP Search Time to warn on over 50 average and 100 max and critical on over 100 average and 500 max and only if number of Search Calls/Sec is greater than 1
Added MSExchangeTransport Queues(_total)\Messages Queued for Delivery Per Second
Removed all MSExchangeMailSubmission Counters as they are only on MBX
Removed MSExchange Database ==> Instances Log Generation Checkpoint Depth - MBX as this was for MBX role
Modified MSExchange Database ==> Instances(edgetransport/Transport Mail Database)\Log Threads Waiting to warn on greater than 10 and error on 50
Added an error alert for MSExchange Extensibility Agents(*)\Average Agent Processing Time (sec) to error on greater than 60 average
Collapsed all Database counters under MSExchange Database category
Collapsed all MSExchange ADAccess counters under MSExchange ADAccess category
Moved Process(EdgeTransport)\IO* counters into EdgeTransport IO Activity category
Updated MSExchange Database(*)\Database Page Fault Stalls/sec to MSExchange Database(edgetransport)\Database Page Fault Stalls/sec
Updated MSExchange Database ==> Instances(*)\I/O Database Reads Average Latency to MSExchange Database ==> Instances(edgetransport/Transport Mail Database)\I/O Database Reads Average Latency
Updated MSExchange Database ==> Instances(*)\I/O Database Writes Average Latency to MSExchange Database ==> Instances(edgetransport/Transport Mail Database)\I/O Database Writes Average Latency
Added _Total exclusions where necessary
Removed 64bit question
Added a question for pagefile drive
Added edgetransport as an exclusion to Memory\Memory Leak Detection
Added _Global_ as an exclusion to .Net Related\Memory Leak Detection in .Net
Added _Global_ as an exclusion to .Net Related\.NET CLR Exceptions / Second
Updated .Net Related\.NET CLR Exceptions / Second to warn on greater than 100 exceptions per second.
Moved Process(*)\IO Data Operations/sec into an IO Operations category as it is not just disk related
Moved Process(*)\IO Other Operations/sec into an IO Operations category as it is not just disk related
Updated Network Packets Outbound Errors to alert on greater than 0 instead of 1
Updated Network Utilization Analysis to error on greater than 70%
Updated Memory\Page Reads/Sec to only warn on 100 average instead of 100 max, other thresholds of 1000 and 10000 still remain the same
Updated Memory\Pages Input/Sec's warning to read "More than 1000 pages read per second on average"
Updated Memory\Pages Input/Sec to not warn on max of 1000 (this is too low to warn on 1000 max)
Updated Memory\Pages Output/Sec's warning to read "More than 1000 pages written per second on average"
Updated Memory\Pages Output/Sec to not warn on max of 1000 (this is too low to warn on 1000 max)
Updated .Net\CLR Memory\%Time in GC to include * for process and exclude _Global. Removed 5% threshold and made and 20% threshold warning and error conditions respectively.
Added all Store Interface counters.
Added MSExchange Store Interface(*)\ConnectionCache out of limit creations and MSExchange Store Interface(*)\ConnectionCache active connections counters and thresholds
CAS:
Created a new CAS file based off of the common updates in the new MBX xml
Updated ASP.NET\Request Wait Time to warn on greater than 1000 max and error on 5000 max
Updated ASP.NET Applications(__Total__)\Requests In Application Queue to error on 3000 rather than 2500
Updated MSExchange Availability Service\Average Time to Process a Free Busy Request to warn on 5 avg or max and error on 25 avg or max
Updated MSExchange Availability Service\Average Time to Process a Cross-Site Free Busy Request to warn on 5 avg or max and error on 25 avg or max
Updated MSExchange OWA\Average Response Time to warn on max greater than 100 and more than 2 OWA requests per second on average
Updated MSExchange OWA\Average Search Time to warn on max greater than 31000
Updated MSExchangeFDS:OAB(*)\Download Task Queued to warn on avg greater than 0
Moved Process(*)\IO Data Operations/sec into an IO Operations category as it is not just disk related
Moved Process(*)\IO Other Operations/sec into an IO Operations category as it is not just disk related
Updated ASP.Net Requests Current to warn on greater than 1000 and error on greater than 5000 (max size it can get to is 5000 before requests are rejected)
Added all Store Interface counters.
Added MSExchange Store Interface(*)\ConnectionCache out of limit creations and MSExchange Store Interface(*)\ConnectionCache active connections counters and thresholds
HUB/CAS:
- Combined both HUB and CAS XMLs for analysis of combined roles.
- Added all Store Interface counters.
- Added MSExchange Store Interface(*)\ConnectionCache out of limit creations and MSExchange Store Interface(*)\ConnectionCache active connections counters and thresholds
Comments
- Anonymous
January 01, 2003
Hi Mike...rich content...congratulations. Regards, Dirk.
