A few new things in XML plan to help you troubleshoot query performance
In this blog Added per-operator level performance stats for Query Processing, Senior PM in QP talks about extending operator level performance stats. They include stats related to reads, CPU and elapse time. These are very helpful to track down query performance issues. We worked on recent case where we put ActualElapsedms in a good use.
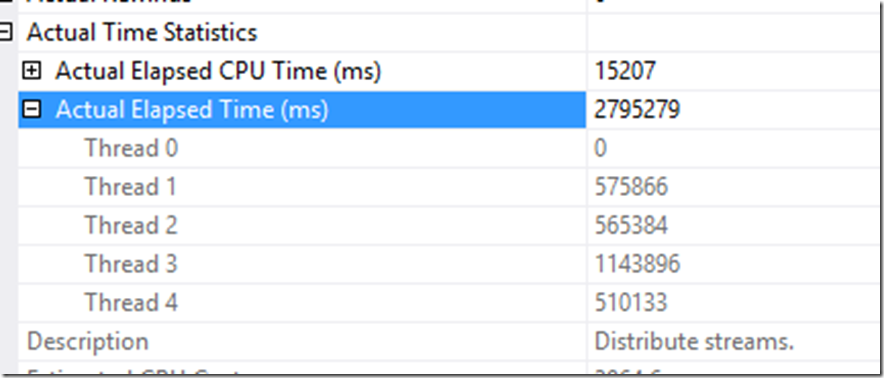
In this case, customer stated a merge query ran very slowly and wanted us to help improve the performance. By examining ActualElapsedms which is displayed as “Actual Elapsed Time(ms)”, we quickly found out which operator was taking most of the time. In this case, it’s a “Distributed streams” parallel operator that caused most slowdown. Upon further operation, the operator caused spill (‘exchange spill’). so we were able to provide a relief to use serial plan. The original plan took over 20 minutes but serial plan took less than a 1 minute. Knowing how where most of the time is spent will help you understand the issue sooner.
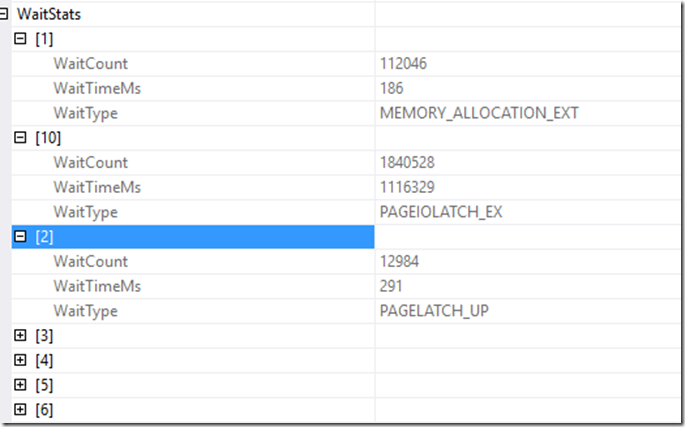
I also want to point out another improvement as documented in SQL 2016 SP1 release. We also added top wait stats for the query. if your query runs slowly but consumes very little CPU, this will be a great help. In the past, the only way to get this is to use wait_info xevent. Now it’s part of xml execution plan. Below is an example of wait stats gathered from same plan as above. Please note that you just have WaitStats for the entire query. You can search WaitStats in XML file. But in SSMS, you will need to click on the very first node of the plan to get this property.
<WaitStats>
<Wait WaitType="MEMORY_ALLOCATION_EXT" WaitTimeMs="186" WaitCount="112046" />
<Wait WaitType="PAGELATCH_UP" WaitTimeMs="291" WaitCount="12984" />
<Wait WaitType="PAGEIOLATCH_SH" WaitTimeMs="371" WaitCount="183" />
<Wait WaitType="SOS_SCHEDULER_YIELD" WaitTimeMs="399" WaitCount="12321" />
<Wait WaitType="WRITELOG" WaitTimeMs="1632" WaitCount="627" />
<Wait WaitType="SLEEP_BUFFERPOOL_HELPLW" WaitTimeMs="1727" WaitCount="886" />
<Wait WaitType="PAGELATCH_EX" WaitTimeMs="8295" WaitCount="225616" />
<Wait WaitType="IO_COMPLETION" WaitTimeMs="10287" WaitCount="5300" />
<Wait WaitType="PAGEIOLATCH_UP" WaitTimeMs="59652" WaitCount="21027" />
<Wait WaitType="PAGEIOLATCH_EX" WaitTimeMs="1116329" WaitCount="1840528" />
</WaitStats>
Note that you may not be able to see the above properties either in XML or SSMS. That may be because you are not on the right version. Additionally, the fact that they are in the xml plan, you may not see them in SSMS if you are not using right version of SSMS.
For per operator level stats (such as logical reads, elapse time) to be included in the plan, you must be on SQL Server 2014 SP2 or SQL 2016 RTM.
For the top wait statis (WaitStats) to be included, you must be on SQL Server 2016 Sp1.
For both properties to show up in SSMS, you must be latest SSMS (Nov 2016 or later release). you can get latest SSMS from Download SQL Server Management Studio (SSMS).
Jack Li |Senior Escalation Engineer | Microsoft SQL Server

