WPF での図形と基本描画の概要
このトピックでは、Shape オブジェクトを使用して描画する方法の概要について説明します。 Shape は UIElement の一種であり、これを使用すると、画面に図形を描画できます。 Shape オブジェクトは UI 要素であるため、Panel 要素やほとんどのコントロール内で使用できます。
Windows Presentation Foundation (WPF) には、グラフィックス サービスやレンダリング サービスへのアクセスのレイヤーがいくつか用意されています。 最上位レイヤーにある Shape オブジェクトは使いやすく、Windows Presentation Foundation (WPF) イベント システムへの参加やレイアウトなど、多くの便利な機能を提供します。
Shape 関連の型は Windows.Shapes 名前空間にあります。 Geometry 関連の型は System.Windows.Media 名前空間にあります。
図形オブジェクト
WPF には、すぐに使用できるさまざまな Shape オブジェクトが用意されています。 すべての図形オブジェクトは Shape クラスを継承します。 使用可能な図形オブジェクトには Ellipse、Line、Path、Polygon、Polyline、Rectangle があります。 Shape オブジェクトは、次の共通プロパティを共有します。
Stroke:図形の枠線を描画する方法を示します。
StrokeThickness:図形の枠線の太さを示します。
Fill:図形の内部を描画する方法を示します。
デバイス非依存ピクセル単位で計測される座標と頂点を指定するデータ プロパティ。
図形オブジェクトは UIElement から派生するため、パネルおよびほとんどのコントロール内で使用できます。 Canvas パネルは子オブジェクトの絶対配置をサポートするため、複雑な描画の作成に特に適しています。
Line クラスを使用すると、2 つの点の間の線を描画できます。 直線の座標およびストローク プロパティを指定するいくつかの方法を次の例に示します。
<Canvas Height="300" Width="300">

  <!-- Draws a diagonal line from (10,10) to (50,50). -->
  <Line
    X1="10" Y1="10"
    X2="50" Y2="50"
    Stroke="Black"
    StrokeThickness="4" />

  <!-- Draws a diagonal line from (10,10) to (50,50)
       and moves it 100 pixels to the right. -->
  <Line
    X1="10" Y1="10"
    X2="50" Y2="50"
    StrokeThickness="4"
    Canvas.Left="100">
    <Line.Stroke>
      <RadialGradientBrush GradientOrigin="0.5,0.5" Center="0.5,0.5" RadiusX="0.5" RadiusY="0.5">
        <RadialGradientBrush.GradientStops>
          <GradientStop Color="Red" Offset="0" />
          <GradientStop Color="Blue" Offset="0.25" />
        </RadialGradientBrush.GradientStops>
      </RadialGradientBrush>
    </Line.Stroke>
  </Line>

  <!-- Draws a horizontal line from (10,60) to (150,60). -->
  <Line
     X1="10" Y1="60"
     X2="150" Y2="60"
     Stroke="Black"
     StrokeThickness="4"/>

</Canvas>
// Add a Line Element
myLine = gcnew Line();
myLine->Stroke = Brushes::LightSteelBlue;
myLine->X1 = 1;
myLine->X2 = 50;
myLine->Y1 = 1;
myLine->Y2 = 50;
myLine->HorizontalAlignment = HorizontalAlignment::Left;
myLine->VerticalAlignment = VerticalAlignment::Center;
myLine->StrokeThickness = 2;
myGrid->Children->Add(myLine);
// Add a Line Element
myLine = new Line();
myLine.Stroke = System.Windows.Media.Brushes.LightSteelBlue;
myLine.X1 = 1;
myLine.X2 = 50;
myLine.Y1 = 1;
myLine.Y2 = 50;
myLine.HorizontalAlignment = HorizontalAlignment.Left;
myLine.VerticalAlignment = VerticalAlignment.Center;
myLine.StrokeThickness = 2;
myGrid.Children.Add(myLine);
' Add a Line Element
Dim myLine As New Line()
myLine.Stroke = Brushes.LightSteelBlue
myLine.X1 = 1
myLine.X2 = 50
myLine.Y1 = 1
myLine.Y2 = 50
myLine.HorizontalAlignment = HorizontalAlignment.Left
myLine.VerticalAlignment = VerticalAlignment.Center
myLine.StrokeThickness = 2
myGrid.Children.Add(myLine)
次の図は、レンダリングされた Line を示しています。
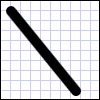
Line クラスは Fill プロパティを備えていますが、Line には領域がないため、このプロパティを設定しても効果はありません。
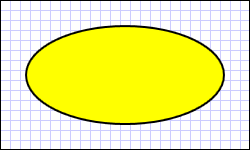
もう 1 つの一般的な図形は Ellipse です。 Ellipse を作成するには、この図形の Width プロパティと Height プロパティを定義します。 円を描画するには、Ellipse と Width の値が等しい Height を指定します。
<Ellipse
Fill="Yellow"
Height="100"
Width="200"
StrokeThickness="2"
Stroke="Black"/>
using System;
using System.Windows;
using System.Windows.Controls;
using System.Windows.Media;
using System.Windows.Shapes;

namespace SDKSample
{
    public partial class SetBackgroundColorOfShapeExample : Page
    {
        public SetBackgroundColorOfShapeExample()
        {
            // Create a StackPanel to contain the shape.
            StackPanel myStackPanel = new StackPanel();

            // Create a red Ellipse.
            Ellipse myEllipse = new Ellipse();

            // Create a SolidColorBrush with a red color to fill the
            // Ellipse with.
            SolidColorBrush mySolidColorBrush = new SolidColorBrush();

            // Describes the brush's color using RGB values.
            // Each value has a range of 0-255.
            mySolidColorBrush.Color = Color.FromArgb(255, 255, 255, 0);
            myEllipse.Fill = mySolidColorBrush;
            myEllipse.StrokeThickness = 2;
            myEllipse.Stroke = Brushes.Black;

            // Set the width and height of the Ellipse.
            myEllipse.Width = 200;
            myEllipse.Height = 100;

            // Add the Ellipse to the StackPanel.
            myStackPanel.Children.Add(myEllipse);

            this.Content = myStackPanel;
        }
    }
}
Imports System.Windows
Imports System.Windows.Controls
Imports System.Windows.Media
Imports System.Windows.Shapes

Namespace SDKSample
    Partial Public Class SetBackgroundColorOfShapeExample
        Inherits Page
        Public Sub New()
            ' Create a StackPanel to contain the shape.
            Dim myStackPanel As New StackPanel()

            ' Create a red Ellipse.
            Dim myEllipse As New Ellipse()

            ' Create a SolidColorBrush with a red color to fill the
            ' Ellipse with.
            Dim mySolidColorBrush As New SolidColorBrush()

            ' Describes the brush's color using RGB values.
            ' Each value has a range of 0-255.
            mySolidColorBrush.Color = Color.FromArgb(255, 255, 255, 0)
            myEllipse.Fill = mySolidColorBrush
            myEllipse.StrokeThickness = 2
            myEllipse.Stroke = Brushes.Black

            ' Set the width and height of the Ellipse.
            myEllipse.Width = 200
            myEllipse.Height = 100

            ' Add the Ellipse to the StackPanel.
            myStackPanel.Children.Add(myEllipse)

            Me.Content = myStackPanel
        End Sub

    End Class
End Namespace
次の図は、レンダリングされた Ellipse の例を示しています。
パスとジオメトリの使用
Path クラスを使用すると、曲線や複雑な図形を描画できます。 これらの曲線と図形は、Geometry オブジェクトを使用して記述します。 Path を使用するには、Geometry を作成し、それを使用して Path オブジェクトの Data プロパティを設定します。
さまざまな Geometry オブジェクトから選択できます。 LineGeometry、RectangleGeometry、EllipseGeometry の各クラスは、比較的単純な図形を記述します。 より複雑な図形を作成したり、曲線を作成したりするには、PathGeometry を使用します。
PathGeometry と PathSegment
PathGeometry オブジェクトは、1 つまたは複数の PathFigure オブジェクトで構成されます。各 PathFigure は、異なる "図" または図形を表します。 各 PathFigure は、それぞれが図または図形の結合部分を表す 1 つ以上の PathSegment オブジェクトで構成されています。 セグメントの種類には LineSegment、BezierSegment、 ArcSegment があります。
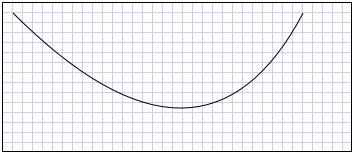
次の例では、Path を使用して 2 次ベジエ曲線を描画します。
<Path Stroke="Black" StrokeThickness="1">
  <Path.Data>
    <PathGeometry>
      <PathGeometry.Figures>
        <PathFigureCollection>
          <PathFigure StartPoint="10,100">
            <PathFigure.Segments>
              <PathSegmentCollection>
                <QuadraticBezierSegment Point1="200,200" Point2="300,100" />
              </PathSegmentCollection>
            </PathFigure.Segments>
          </PathFigure>
        </PathFigureCollection>
      </PathGeometry.Figures>
    </PathGeometry>
  </Path.Data>
</Path>
レンダリングされた図形を次の図に示します。
PathGeometry クラスおよび他の Geometry クラスの詳細については、「ジオメトリの概要」をご覧ください。
省略された XAML 構文
Extensible Application Markup Language (XAML) では、省略された特殊な構文を使用して Path を記述することもできます。 次の例では、省略された構文を使用して複雑な図形を描画します。
      <Path Stroke="DarkGoldenRod" StrokeThickness="3"
Data="M 100,200 C 100,25 400,350 400,175 H 280" />
次の図は、レンダリングされた Path を示しています。
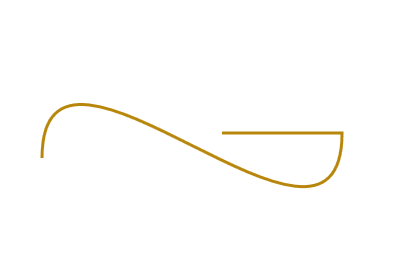
Data 属性文字列は、M で示される "moveto" コマンドで始まります。このコマンドは、Canvas の座標系のパスの始点を設定します。 Path データ パラメーターの大文字と小文字は区別されます。 大文字の M は、現在の新しい点の絶対位置を示します。 小文字の m は、相対座標を示します。 最初のセグメントは、2 つの制御点 (100,25) と (400,350) を使用して描画される、始点が (100,200) で終点が (400,175) の 3 次ベジエ曲線です。 このセグメントは、Data 属性文字列の C コマンドによって示されます。 ここでも、大文字の C は絶対パスを示し、小文字の c は相対パスを示します。
2 番目のセグメントは、絶対水平 "lineto" コマンド H で始まります。このコマンドは、前のサブパスの終点 (400,175) から新しい終点 (280,175) まで描画される直線を指定します。 水平 "lineto" コマンドであるため、指定される値は x 座標です。
パス構文全体については、Data のリファレンスと「PathGeometry を使用して図形を作成する」をご覧ください。
図形の塗りつぶし
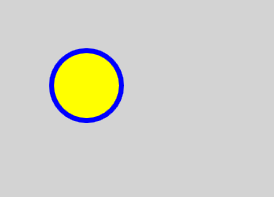
Brush オブジェクトは、図形の Stroke と Fill を塗りつぶすために使用します。 次の例では、Ellipse のストロークおよび塗りつぶしを指定します。 ブラシ プロパティの有効な入力は、キーワードまたは 16 進数のカラー値のいずれかです。 使用可能な色のキーワードの詳細については、Colors 名前空間の System.Windows.Media クラスのプロパティをご覧ください。
<Canvas Background="LightGray">
   <Ellipse
      Canvas.Top="50"
      Canvas.Left="50"
      Fill="#FFFFFF00"
      Height="75"
      Width="75"
      StrokeThickness="5"
      Stroke="#FF0000FF"/>
</Canvas>
次の図は、レンダリングされた Ellipse を示しています。
あるいは、プロパティ要素構文を使用して SolidColorBrush オブジェクトを明示的に作成し、純色で図形を塗りつぶすこともできます。
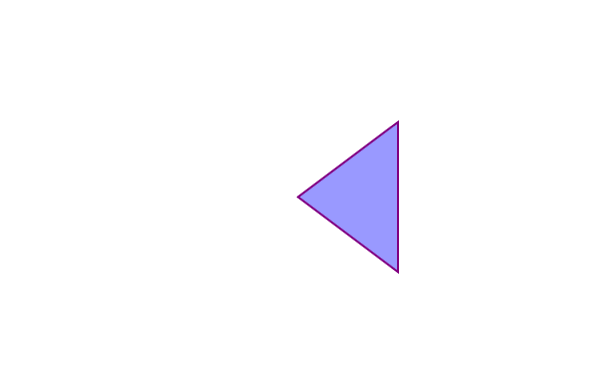
<!-- This polygon shape uses pre-defined color values for its Stroke and
     Fill properties.
     The SolidColorBrush's Opacity property affects the fill color in
     this case by making it slightly transparent (opacity of 0.4) so
     that it blends with any underlying color. -->

<Polygon
    Points="300,200 400,125 400,275 300,200"
    Stroke="Purple"
    StrokeThickness="2">
    <Polygon.Fill>
       <SolidColorBrush Color="Blue" Opacity="0.4"/>
    </Polygon.Fill>
</Polygon>
レンダリングされた図形を次の図に示します。
図形のストロークまたは塗りつぶしをグラデーション、イメージ、パターンなどで塗りつぶすこともできます。 詳細については、「純色およびグラデーションによる塗りつぶしの概要」をご覧ください。
伸縮可能な図形
Line、Path、Polygon、Polyline、Rectangle の各クラスには、すべて Stretch プロパティがあります。 このプロパティにより、Shape オブジェクトのコンテンツ (描画される図形) がどのように引き伸ばされて Shape オブジェクトのレイアウト空間を埋めるかが決まります。 Shape オブジェクトのレイアウト空間とは、レイアウト システムによって Shape に割り当てられる空間の大きさであり、Width と Height の明示的な設定または HorizontalAlignment と VerticalAlignment の設定によって決まります。 Windows Presentation Foundation のレイアウトの詳細については、「レイアウト」をご覧ください。
プロパティには、次のいずれかの値を指定します。
Fill:Shape オブジェクトのコンテンツは、レイアウト空間を塗りつぶすように引き伸ばされます。 縦横比は維持されません。
Uniform:Shape オブジェクトのコンテンツは、元の縦横比を維持しながら、レイアウト空間を塗りつぶすように可能な限り引き伸ばされます。
UniformToFill:Shape オブジェクトのコンテンツは、元の縦横比を維持しながら、レイアウト空間を完全に塗りつぶすように引き伸ばされます。
Shape オブジェクトのコンテンツが引き伸ばされると、Shape オブジェクトの枠線は、引き伸ばし後に塗りつぶされることに注意してください。
次の例では、Polygon を使用して、頂点が (0,0)、(0,1)、および (1,1) の非常に小さい三角形を描画します。 Polygon オブジェクトの Width と Height が 100 に設定され、その Stretch プロパティが Fill に設定されています。 その結果、Polygon オブジェクトのコンテンツ (三角形) は、より大きい空間を塗りつぶすように引き伸ばされます。
<Polygon
  Points="0,0 0,1 1,1"
  Fill="Blue"
  Width="100"
  Height="100"
  Stretch="Fill"
  Stroke="Black"
  StrokeThickness="2" />
PointCollection myPointCollection = new PointCollection();
myPointCollection.Add(new Point(0,0));
myPointCollection.Add(new Point(0,1));
myPointCollection.Add(new Point(1,1));

Polygon myPolygon = new Polygon();
myPolygon.Points = myPointCollection;
myPolygon.Fill = Brushes.Blue;
myPolygon.Width = 100;
myPolygon.Height = 100;
myPolygon.Stretch = Stretch.Fill;
myPolygon.Stroke = Brushes.Black;
myPolygon.StrokeThickness = 2;
図形の変換
Transform クラスは、2 次元の平面で図形を変換する手段を提供します。 変換には、回転 (RotateTransform)、スケール (ScaleTransform)、傾斜 (SkewTransform)、平行移動 (TranslateTransform) など、さまざまな種類があります。
図形に適用される一般的な変換は回転です。 図形を回転させるには、RotateTransform を作成して、その Angleを指定します。 たとえば、Angle が 45 の場合は要素が時計回りに 45 度回転し、90 の場合は要素が時計回りに 90 度回転します。 要素を回転させるときの中心点を制御する場合は、CenterX プロパティと CenterY プロパティを設定します。 これらのプロパティ値は、変換する要素の座標空間で表します。 CenterX と CenterY の既定値は 0 です。 最後に、要素に RotateTransform を適用します。 変換がレイアウトに影響しないようにするには、図形の RenderTransform プロパティを設定します。
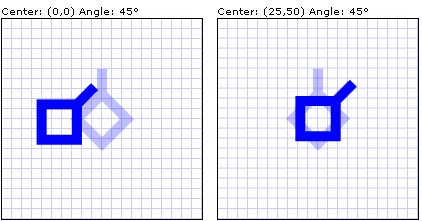
次の例では、RotateTransform を使用して、図形をその左上隅 (0,0) を中心に 45 度回転しています。
<!-- Rotates the Polyline 45 degrees about the point (0,0). -->
<Polyline Points="25,25 0,50 25,75 50,50 25,25 25,0"
  Stroke="Blue" StrokeThickness="10"
  Canvas.Left="75" Canvas.Top="50">
  <Polyline.RenderTransform>
    <RotateTransform CenterX="0" CenterY="0" Angle="45" />
  </Polyline.RenderTransform>
</Polyline>
次の例では、別の図形を 45 度回転していますが、この場合は (25,50) が回転の中心です。
<!-- Rotates the Polyline 45 degrees about its center. -->
<Polyline
  Points="25,25 0,50 25,75 50,50 25,25 25,0"
  Stroke="Blue" StrokeThickness="10"
  Canvas.Left="75" Canvas.Top="50"
  RenderTransformOrigin="0.5,0.5">
  <Polyline.RenderTransform>
    <RotateTransform Angle="45" />
  </Polyline.RenderTransform>
</Polyline>
上記 2 つの変換を適用すると、結果は次の図のようになります。
前の例では、単一の変換を各図形オブジェクトに適用しました。 1 つの図形 (またはその他の UI 要素) に複数の変換を適用するには、TransformGroup を使用します。
関連項目
.NET Desktop feedback
