Getting Started with the Debugger
Note
This article applies to Visual Studio 2015. If you're looking for the latest Visual Studio documentation, see Visual Studio documentation. We recommend upgrading to the latest version of Visual Studio. Download it here
The Visual Studio debugger is easy to use in any language. Here we’ll show how to debug a simple C# program, but you can apply the same steps to code in other languages such as C++ and JavaScript.
Debug a Basic C# Project
Let’s start with a simple C# console application (File / New / Project, then select Visual C# and then select Console Application). If you’ve never worked with Visual Studio before, see Walkthrough: Create a Simple Application. The Main method just adds 1 to an integer variable 10 times and prints the result to the console:
static void Main(string[] args)
{
    int testInt = 0;
    for (int i = 1; i <= 10; i++)
    {
        testInt += 1;
    }
    Console.WriteLine(testInt);
}
Build this code in the Debug configuration. This configuration is set by default. For more information about configurations, see Understanding Build Configurations.
Run this code in the debugger by clicking Debug / Start Debugging (or Start on the toolbar, or F5). The application should exit almost immediately, so you can’t actually tell whether anything was printed in the Console window.
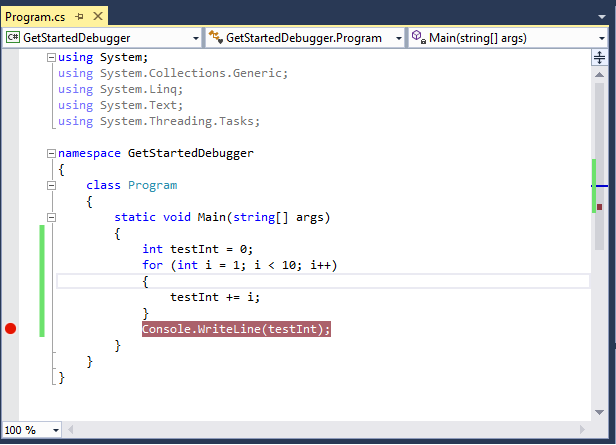
You can stop the execution long enough to see the Console window by setting a breakpoint and then stepping ahead. To set a breakpoint, put your cursor in the Console.WriteLine line and click Debug / New Breakpoint / Function Breakpoint, or just click in the left margin at the same line. The breakpoint should look like this:

For more information about breakpoints, see Using Breakpoints.
Inspect Variables
Debugging often involves finding variables that don't contain the values you expect at a particular point. We will show some of the ways that you can inspect variables.
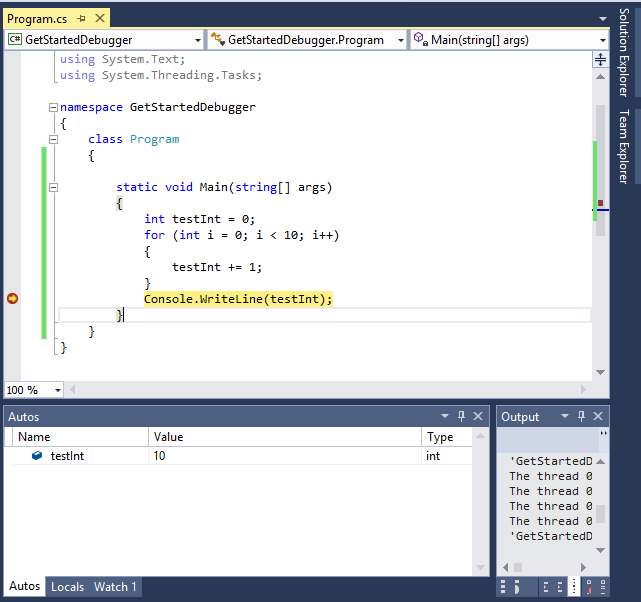
Start debugging again. Execution stops before the Console.WriteLine code executes. You can cause it to execute by stepping ahead (click Debug / Step Over or F10). In this case you could have chosen Step Into (F11) and gotten the same result; we’ll explain the difference later on. The line with the last curly brace of the method should have turned yellow. Look at the Console window. You should see 10.
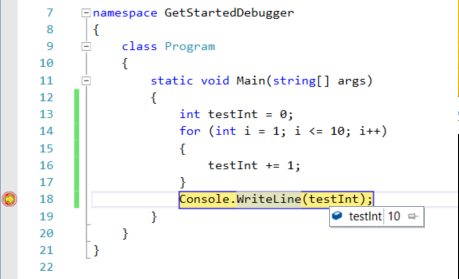
You can hover over the testInt variable to view the current value in a data tip.

Just below the code window you should see the Autos, Locals, and Watch windows. These windows show the current values of variables at the time of execution. Both the Autos and the Locals windows show testInt with a value of 10.

For more information about these windows, see Autos and Locals Windows.
Let’s see how the variable value changes as we walk through the program. Set a breakpoint on the testInt += 1; line, and restart debugging. You should see that testInt in the Locals and Autos windows is 0, and i is 1. When you continue debugging (Debug / Continue, or Continue on the toolbar, or F5), you can see that the value of testInt changes to 1, then 2, and so on. When you get tired of looking at these changes, remove the breakpoint (Debug / Toggle Breakpoint, or click on it in the margin), and continue debugging. If you want to remove all the breakpoints, click Debug / Delete All Breakpoints, or CTRL+SHIFT+F9, and click Yes on the dialog box that asks Do you want to remove all breakpoints?.
Stepping Into and Over Function Calls
You can execute code in the debugger statement-by-statement (Step Into) or you can execute code while the debugger skips functions (Step Over) to quickly get to code that you're more interested in (function code is still executed). You can switch between both methods in the same debugging session.
To see the difference between Step Into and Step Over, we need to add a method that is called by another method. Add a method to the C# application and call it from the Main method. The code should look something like this:
static void Main(string[] args)
{
    Method1();
    Console.WriteLine("end");
}

private static void Method1()
{
    Console.WriteLine("in Method1");
}
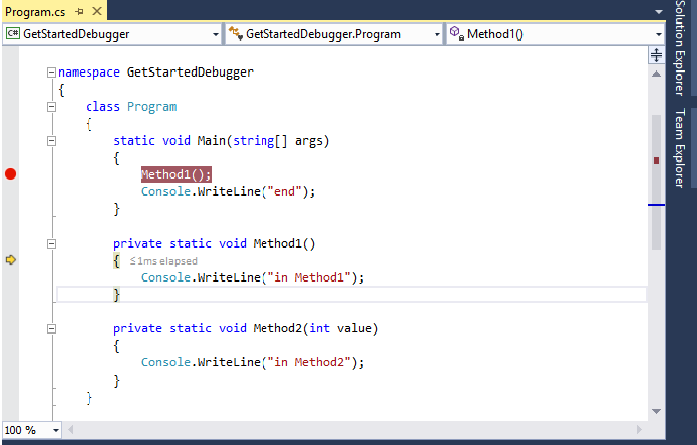
Set a breakpoint on the Method1(); call in the Main method and start debugging. When execution breaks, click Debug / Step Into (or Step Into on the toolbar, or F11). Execution breaks again at the first curly brace in Method1():

Stop debugging and start again, and when execution breaks at the breakpoint, click Debug / Step Over (or Step Over on the toolbar, or F10). Execution breaks again at Console.WriteLine("end");.
If you want to know more about navigating code with the debugger, see Navigating through Code with the Debugger.