AKS의 HDInsight에서 Apache Spark™ 클러스터에 대한 작업 제출하고 관리하기
참고 항목
2025년 1월 31일에 Azure HDInsight on AKS가 사용 중지됩니다. 2025년 1월 31일 이전에 워크로드가 갑자기 종료되지 않도록 워크로드를 Microsoft Fabric 또는 동등한 Azure 제품으로 마이그레이션해야 합니다. 구독의 나머지 클러스터는 호스트에서 중지되고 제거됩니다.
사용 중지 날짜까지 기본 지원만 사용할 수 있습니다.
Important
이 기능은 현지 미리 보기로 제공됩니다. Microsoft Azure 미리 보기에 대한 보충 사용 약관에는 베타 또는 미리 보기로 제공되거나 아직 일반 공급으로 릴리스되지 않은 Azure 기능에 적용되는 더 많은 약관이 포함되어 있습니다. 이 특정 미리 보기에 대한 자세한 내용은 Azure HDInsight on AKS 미리 보기 정보를 참조하세요. 질문이나 기능 제안이 있는 경우 AskHDInsight에서 세부 정보와 함께 요청을 제출하고 Azure HDInsight 커뮤니티에서 더 많은 업데이트를 확인하세요.
클러스터가 만들어지면 사용자는 다양한 인터페이스를 사용하여 작업을 제출하고 관리할 수 있습니다.
- Jupyter 사용
- Zeppelin 사용
- ssh 사용(spark-submit)
Jupyter 사용
필수 조건
AKS의 HDInsight에 있는 Apache Spark 클러스터입니다. 자세한 내용은 Apache Spark 클러스터 만들기를 참조하세요.
Jupyter Notebook은 다양한 프로그래밍 언어를 지원하는 대화형 Notebook 환경입니다.
Jupyter Notebook 만들기
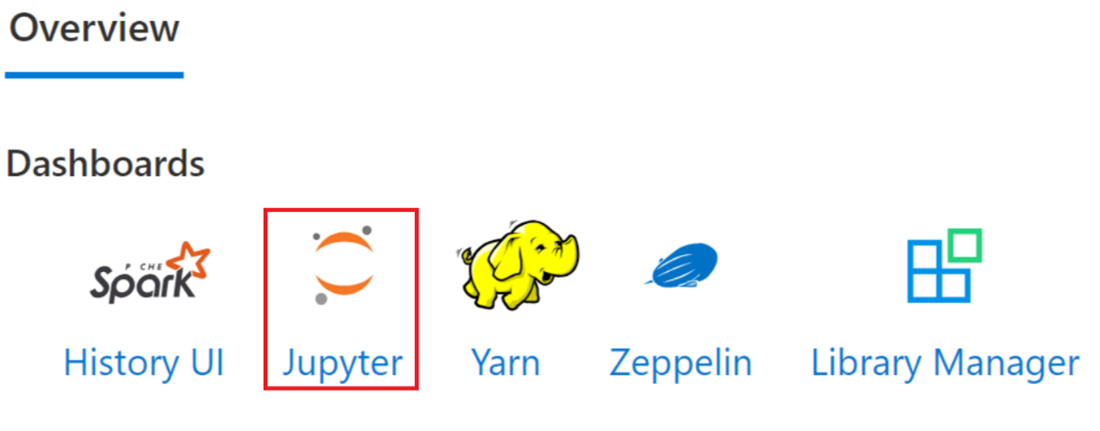
Apache Spark™ 클러스터 페이지로 이동하여 개요 탭을 엽니다. Jupyter를 클릭하면 Jupyter 웹 페이지를 인증하고 열 것을 요청합니다.
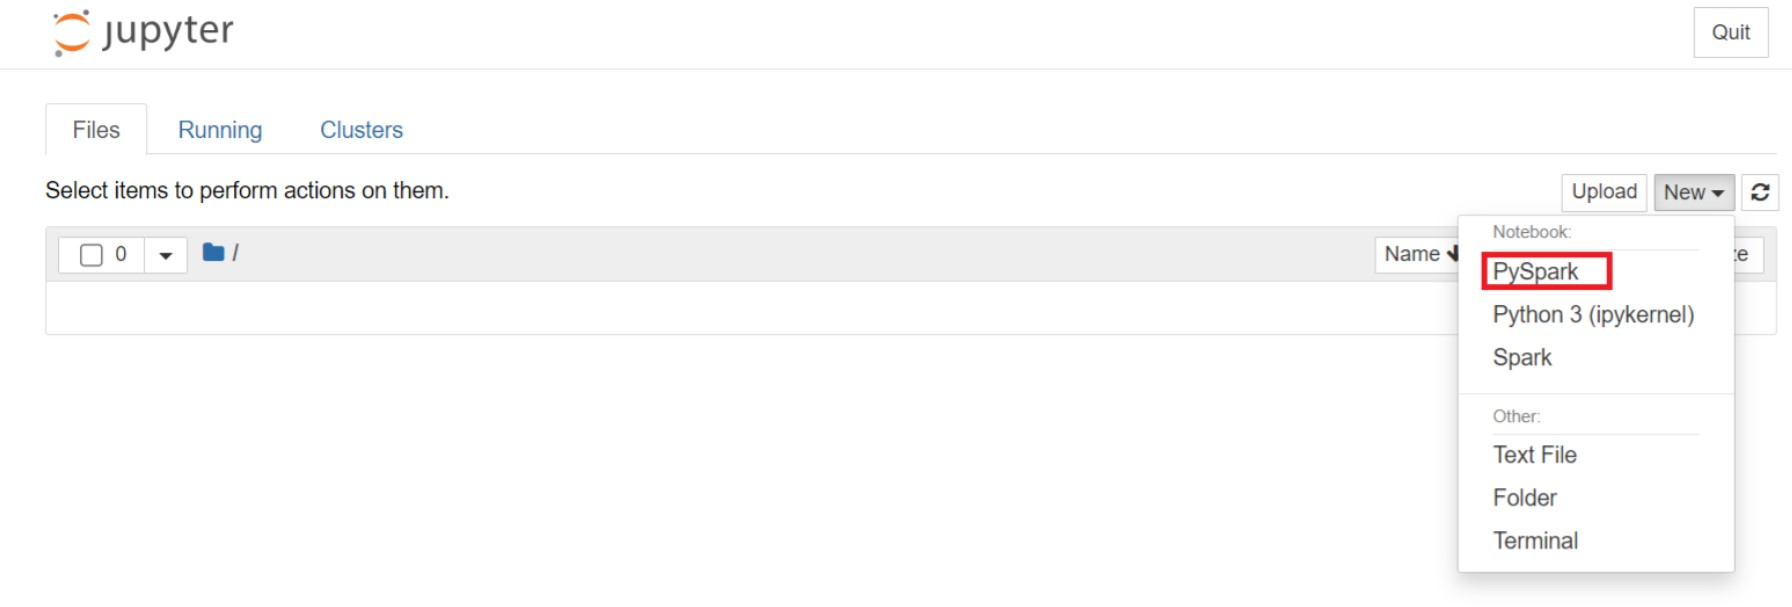
Jupyter 웹 페이지에서 새 > PySpark를 선택하여 Notebook을 만듭니다.
Untitled(Untitled.ipynb)이름으로 새 Notebook이 생성되어 열렸습니다.참고 항목
PySpark 또는 Python 3 커널을 사용하여 Notebook을 만들면 첫 번째 코드 셀을 실행할 때 Spark 세션이 자동으로 만들어집니다. 세션을 명시적으로 만들 필요가 없습니다.
Jupyter Notebook의 빈 셀에 다음 코드를 붙여넣은 다음, SHIFT + ENTER를 눌러 해당 코드를 실행합니다. Jupyter에 대한 자세한 컨트롤은 여기를 참조하세요.
%matplotlib inline
import pandas as pd
import matplotlib.pyplot as plt
data1 = [22,40,10,50,70]
s1 = pd.Series(data1)   #One-dimensional ndarray with axis labels (including time series).

data2 = data1
index = ['John','sam','anna','smith','ben']
s2 = pd.Series(data2,index=index)

data3 = {'John':22, 'sam':40, 'anna':10,'smith':50,'ben':70}
s3 = pd.Series(data3)

s3['jp'] = 32     #insert a new row
s3['John'] = 88

names = ['John','sam','anna','smith','ben']
ages = [10,40,50,48,70]
name_series = pd.Series(names)
age_series = pd.Series(ages)

data_dict = {'name':name_series, 'age':age_series}
dframe = pd.DataFrame(data_dict)
#create a pandas DataFrame from dictionary

dframe['age_plus_five'] = dframe['age'] + 5
#create a new column
dframe.pop('age_plus_five')
#dframe.pop('age')

salary = [1000,6000,4000,8000,10000]
salary_series = pd.Series(salary)
new_data_dict = {'name':name_series, 'age':age_series,'salary':salary_series}
new_dframe = pd.DataFrame(new_data_dict)
new_dframe['average_salary'] = new_dframe['age']*90

new_dframe.index = new_dframe['name']
print(new_dframe.loc['sam'])
급여와 나이를 X축 및 Y축으로 하여 그래프 그리기
동일한 Notebook에서 Jupyter Notebook의 빈 셀에 다음 코드를 붙여넣은 다음, SHIFT + ENTER를 눌러 해당 코드를 실행합니다.
%matplotlib inline
import pandas as pd
import matplotlib.pyplot as plt

plt.plot(age_series,salary_series)
plt.show()
Notebook 저장
Notebook 메뉴 모음에서 파일 > 저장 및 검사점으로 이동합니다.
Notebook을 종료하여 클러스터 리소스를 해제합니다. Notebook 메뉴 모음에서 파일 > 닫기 및 중지로 이동합니다. 예제 폴더에서 Notebook을 실행할 수도 있습니다.
Apache Zeppelin Notebook 사용
AKS의 HDInsight에 있는 Apache Spark 클러스터에는 Apache Zeppelin Notebook이 포함되어 있습니다. 해당 Notebook을 사용하여 Apache Spark 작업을 실행합니다. 이 문서에서는 AKS의 HDInsight 클러스터에서 Zeppelin Notebook을 사용하는 방법에 대해 알아봅니다.
필수 조건
AKS의 HDInsight에 있는 Apache Spark 클러스터입니다. 자세한 내용은 Apache Spark 클러스터 만들기를 참조하세요.
Apache Zeppelin Notebook 시작
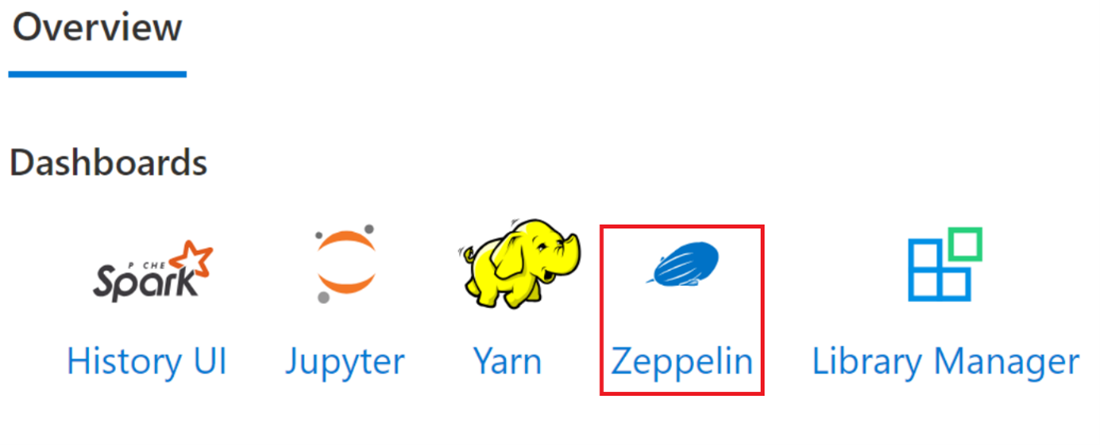
Apache Spark 클러스터 개요 페이지로 이동하여 클러스터 대시보드에서 Zeppelin Notebook을 선택합니다. Zeppelin 페이지를 인증하고 열라는 메시지가 표시됩니다.
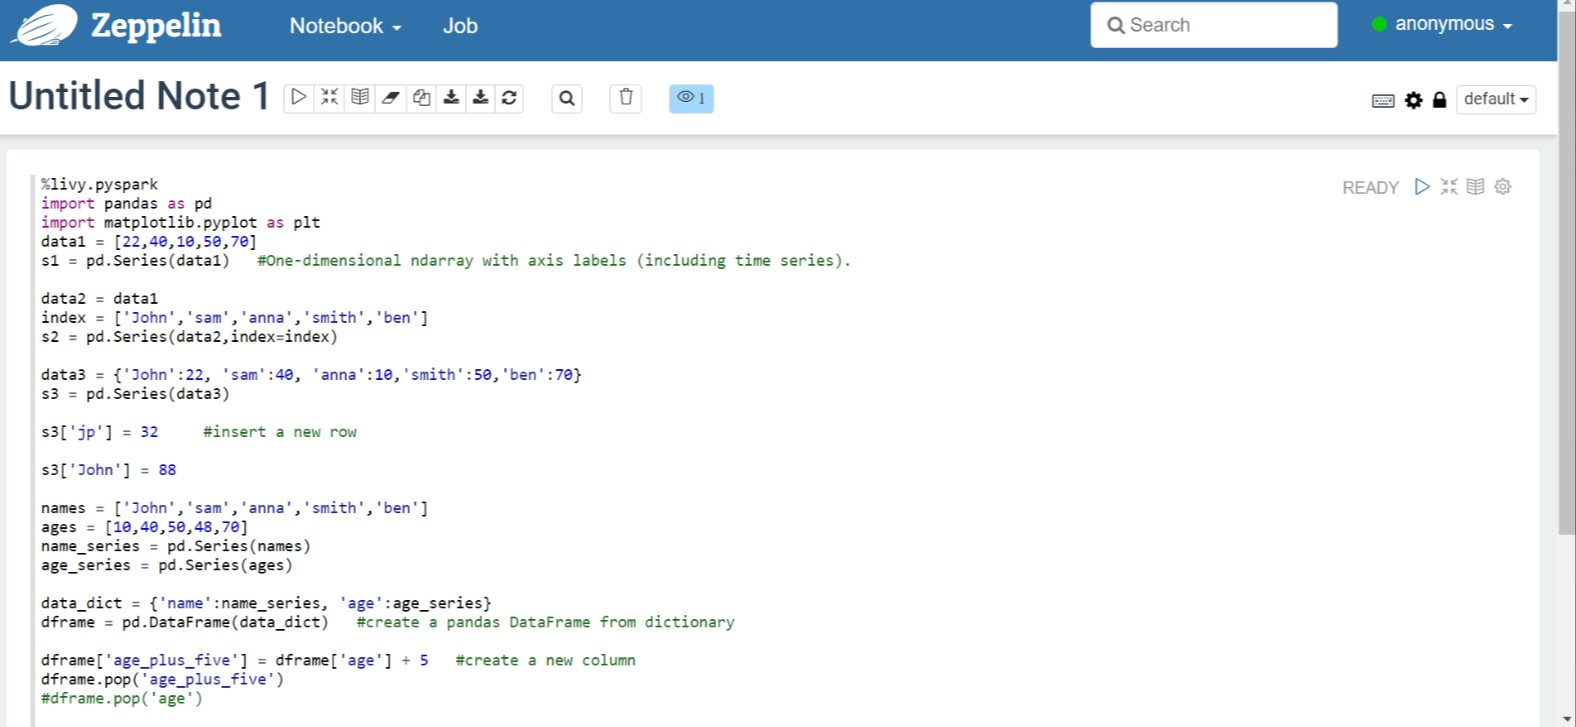
새 Notebook을 만듭니다. 헤더 창에서 Notebook > 새 메모 만들기로 이동합니다. 노트북 헤더에 연결된 상태가 표시되는지 확인합니다. 오른쪽 상단 모서리에 있는 녹색 점을 나타냅니다.
Zeppelin Notebook에서 다음 코드를 실행합니다.
%livy.pyspark
import pandas as pd
import matplotlib.pyplot as plt
data1 = [22,40,10,50,70]
s1 = pd.Series(data1)   #One-dimensional ndarray with axis labels (including time series).

data2 = data1
index = ['John','sam','anna','smith','ben']
s2 = pd.Series(data2,index=index)

data3 = {'John':22, 'sam':40, 'anna':10,'smith':50,'ben':70}
s3 = pd.Series(data3)

s3['jp'] = 32     #insert a new row

s3['John'] = 88

names = ['John','sam','anna','smith','ben']
ages = [10,40,50,48,70]
name_series = pd.Series(names)
age_series = pd.Series(ages)

data_dict = {'name':name_series, 'age':age_series}
dframe = pd.DataFrame(data_dict)   #create a pandas DataFrame from dictionary

dframe['age_plus_five'] = dframe['age'] + 5   #create a new column
dframe.pop('age_plus_five')
#dframe.pop('age')

salary = [1000,6000,4000,8000,10000]
salary_series = pd.Series(salary)
new_data_dict = {'name':name_series, 'age':age_series,'salary':salary_series}
new_dframe = pd.DataFrame(new_data_dict)
new_dframe['average_salary'] = new_dframe['age']*90

new_dframe.index = new_dframe['name']
print(new_dframe.loc['sam'])
단락에 대한 재생 단추를 선택하여 코드 조각을 실행합니다. 단락의 오른쪽 모서리 상태가 준비, 보류 중, 실행 중, 완료 순서로 진행됩니다. 출력은 같은 단락 하단에 표시됩니다. 스크린샷은 다음 이미지와 같습니다.
출력
Spark 제출 작업 사용
다음 명령 '#vim samplefile.py'를 사용하여 파일을 만듭니다.
이 명령은 vim 파일을 엽니다.
다음 코드를 vim 파일에 붙여넣습니다.
import pandas as pd
import matplotlib.pyplot as plt

From pyspark.sql import SparkSession
Spark = SparkSession.builder.master('yarn').appName('SparkSampleCode').getOrCreate()
# Initialize spark context
data1 = [22,40,10,50,70]
s1 = pd.Series(data1)   #One-dimensional ndarray with axis labels (including time series).

data2 = data1
index = ['John','sam','anna','smith','ben']
s2 = pd.Series(data2,index=index)

data3 = {'John':22, 'sam':40, 'anna':10,'smith':50,'ben':70}
 s3 = pd.Series(data3)

s3['jp'] = 32     #insert a new row

s3['John'] = 88

names = ['John','sam','anna','smith','ben']
ages = [10,40,50,48,70]
name_series = pd.Series(names)
age_series = pd.Series(ages)

data_dict = {'name':name_series, 'age':age_series}
dframe = pd.DataFrame(data_dict)   #create a pandas DataFrame from dictionary

dframe['age_plus_five'] = dframe['age'] + 5   #create a new column
dframe.pop('age_plus_five')
#dframe.pop('age')

salary = [1000,6000,4000,8000,10000]
salary_series = pd.Series(salary)
new_data_dict = {'name':name_series, 'age':age_series,'salary':salary_series}
new_dframe = pd.DataFrame(new_data_dict)
new_dframe['average_salary'] = new_dframe['age']*90

new_dframe.index = new_dframe['name']
print(new_dframe.loc['sam'])
다음 메서드를 사용하여 파일을 저장합니다.
- 이스케이프 단추 누르기
- 명령
:wq입력하기
다음 명령을 실행하여 작업을 실행합니다.
/spark-submit --master yarn --deploy-mode cluster <filepath>/samplefile.py
AKS의 HDInsight에 있는 Apache Spark 클러스터에서 쿼리 모니터링
Spark 기록 UI
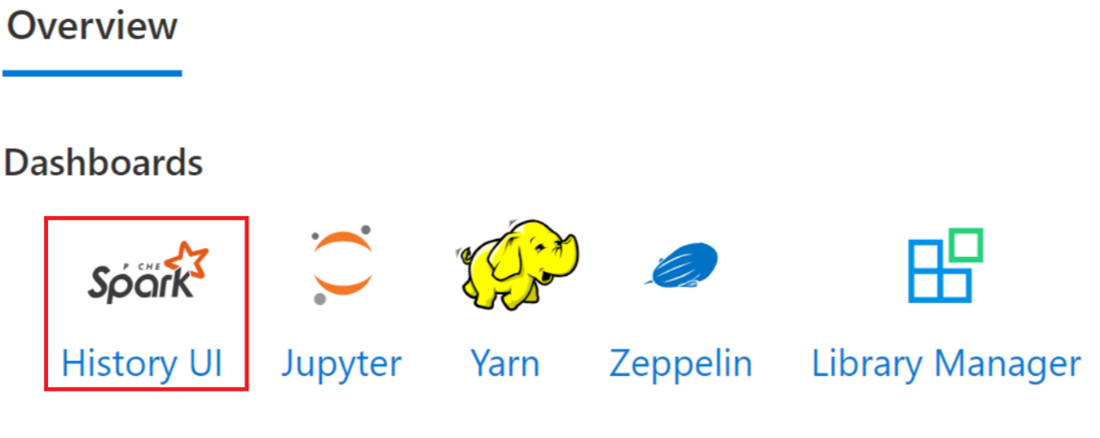
개요 탭에서 Spark 기록 서버 UI를 클릭합니다.
동일한 애플리케이션 ID를 사용하여 UI에서 최근 실행을 선택합니다.
Spark 기록 서버 UI에서 방향성 비순환 그래프 주기 및 작업 단계를 봅니다.
Livy 세션 UI
Livy 세션 UI를 열려면 브라우저
https://<CLUSTERNAME>.<CLUSTERPOOLNAME>.<REGION>.projecthilo.net/p/livy/ui에 다음 명령을 입력합니다.로그에서 드라이버 옵션을 클릭하여 드라이버 로그를 봅니다.
Yarn UI
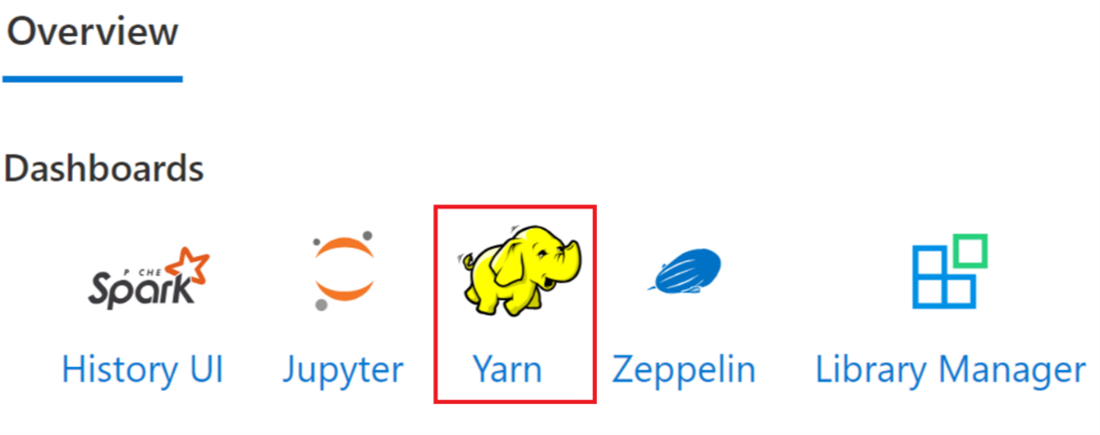
개요 탭에서 Yarn을 클릭하고 Yarn UI를 엽니다.
동일한 애플리케이션 ID로 최근에 실행한 작업을 추적할 수 있습니다.
Yarn에서 애플리케이션 ID를 클릭하여 작업의 자세한 로그를 봅니다.
참조
- Apache, Apache Spark, Spark 및 관련 오픈 소스 프로젝트 이름은 ASF(Apache Software Foundation)의 상표입니다.
