Viewing Process Name Data
The capability to view process names in message data captured by any ETW trace provider is now native to Message Analyzer, although detection of process names is currently not guaranteed for incoming messages. This means that you can add the ProcessName field (from the Global Properties node of Field Chooser) as a new Analysis Grid viewer column and view process name data across a set of trace results. If you also add a Network field column from the IPv4 node in Field Chooser, you can correlate the IP conversations with which the process names are associated. The input file types in which you can view process name data include .matp, .etl, .evtx, and .cap files.
Using the ProcessName Property
If you want to isolate the messages that were captured by Message Analyzer for each process, you can execute the Group command on the ProcessName column of the Analysis Grid viewer to separate the trace messages into groups of ProcessName nodes, where each node contains all the messages associated with a particular process name. You can create this grouped display configuration by right-clicking the ProcessName column header and then selecting the Group command. If you also added the Network field as a new Analysis Grid viewer column, as suggested earlier, you can similarly execute the Group command on this column to correlate the associated network conversations with process names.
Alternatively, you could simply display the Process Name and Conversations view Layout for the Analysis Grid from the Layout drop-down list on the Analysis Grid viewer toolbar to view similar data. However, note that this Layout also adds a Transport group that exposes the ports that carried the network conversations. In any case, the data can tell you very quickly which processes are consuming the most bandwidth and can also help you isolate any process (and supporting messages) that you may already suspect is causing a problem.
For incoming messages, Message Analyzer does not guarantee the display of process names. In this case, Message Analyzer should display the ETW ProcessID value in the ProcessName column of the Analysis Grid viewer.
Layouts Containing the ProcessName Field
The ProcessName property is used in the following data viewer Layouts:
Grouping viewer — uses the ProcessName and ProcessId properties in this Layout:
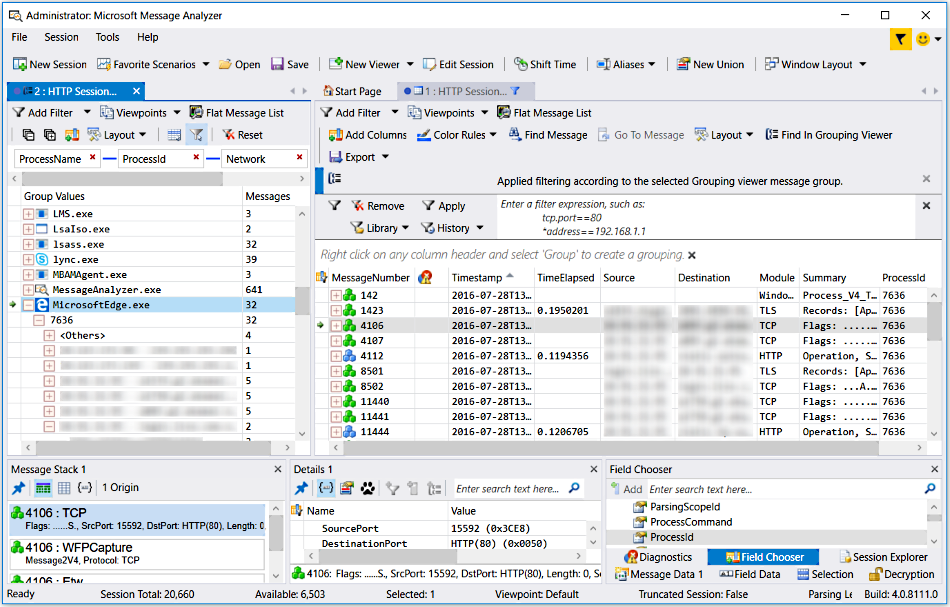
Process Name and Conversations — this Layout (left side of the user interface) simulates the Network Conversation tree in Microsoft Network Monitor, as shown in the figure that follows.

Figure 64: Grouping Viewer ProcessName node selection driving the Analysis Grid viewer
Analysis Grid viewer — uses the ProcessName property in these Layouts:
Process Name and Conversations
Network Monitor
Process View
See Also
Analysis Grid Viewer
Grouping Viewer
Working With Message Analyzer Profiles