Maintain OT network sensors from the sensor console
This article describes extra OT sensor maintenance activities that you might perform outside of a larger deployment process.
OT sensors can also be maintained from the OT sensor CLI or the Azure portal.
Caution
Only documented configuration parameters on the OT network sensor are supported for customer configuration. Do not change any undocumented configuration parameters or system properties, as changes may cause unexpected behavior and system failures.
Removing packages from your sensor without Microsoft approval can cause unexpected results. All packages installed on the sensor are required for correct sensor functionality.
Prerequisites
Before performing the procedures in this article, make sure that you have:
An OT network sensor installed, configured, and activated and onboarded to Defender for IoT in the Azure portal.
Access to the OT sensor as an Admin user. Selected procedures and CLI access also requires a privileged user. For more information, see On-premises users and roles for OT monitoring with Defender for IoT.
To download software for OT sensors, you need access to the Azure portal as a Security Admin, Contributor, or Owner user.
An SSL/TLS certificate prepared if you need to update your sensor's certificate.
View overall OT sensor status
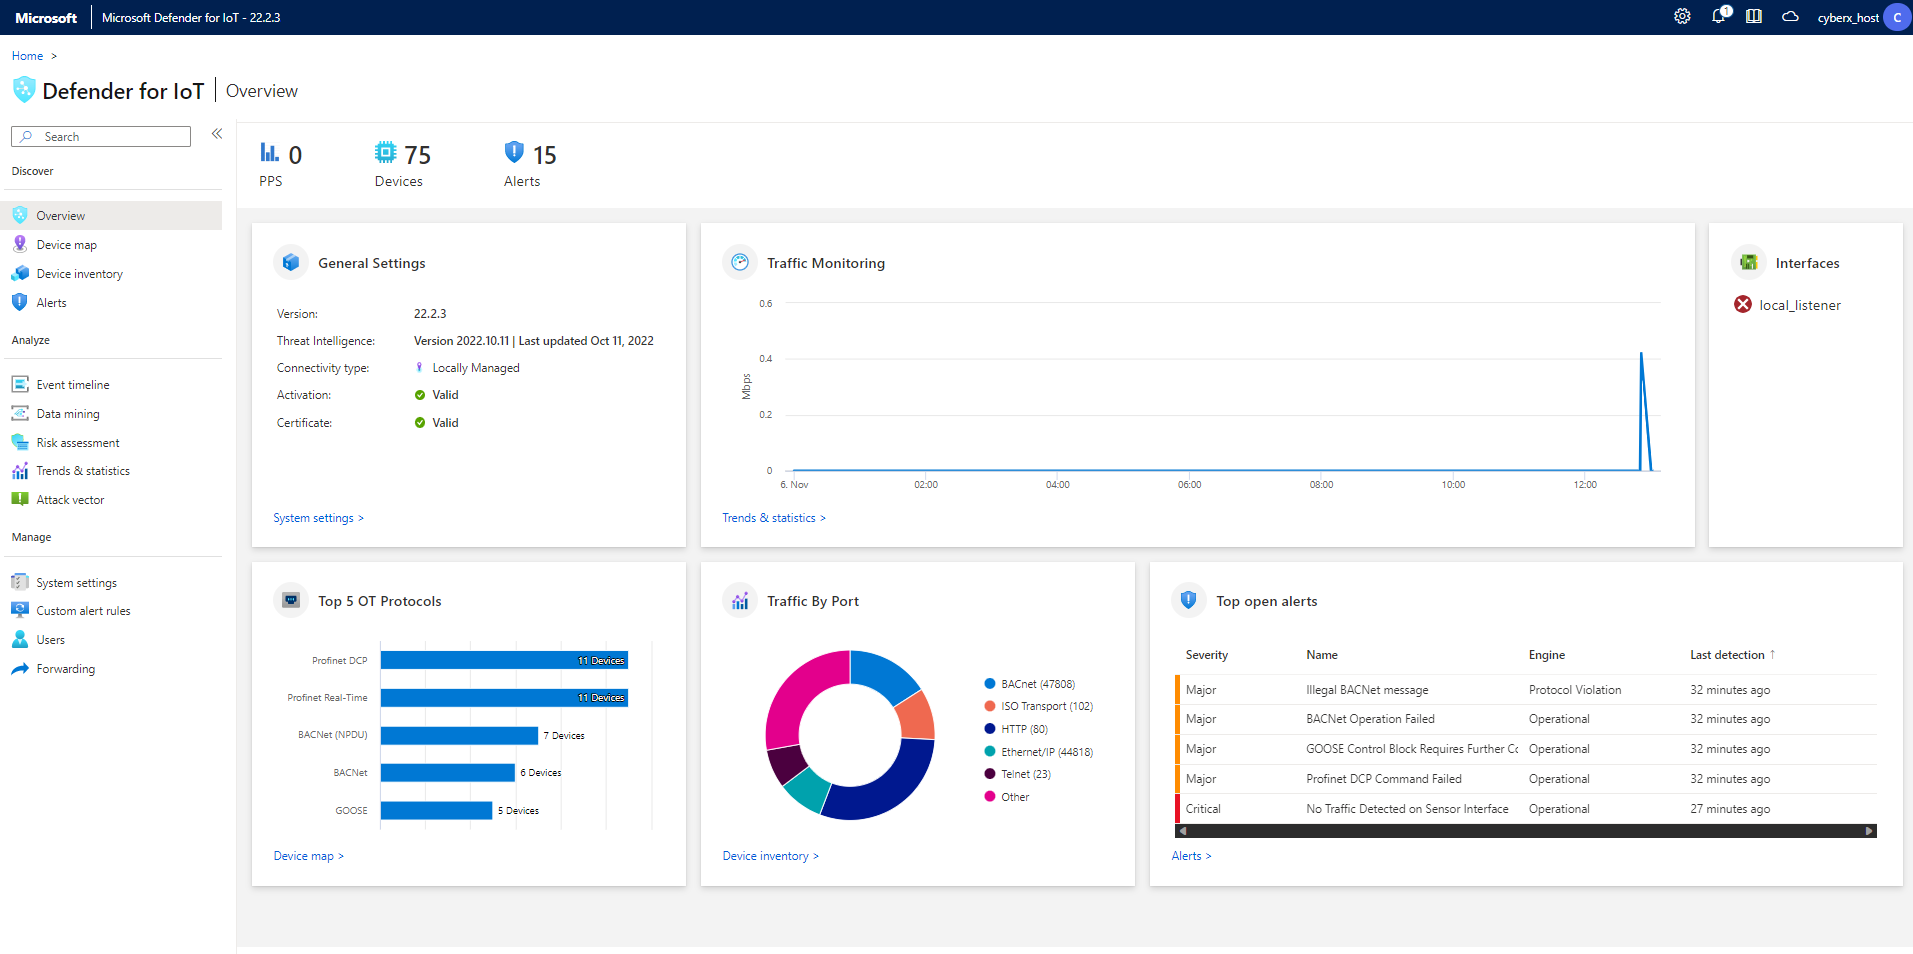
When you sign into your OT sensor, the first page shown is the Overview page.
For example:
The Overview page shows the following widgets:
| Name | Description |
|---|---|
| General Settings | Displays a list of the sensor's basic configuration settings and connectivity status. |
| Traffic Monitoring | Displays a graph detailing traffic in the sensor. The graph shows traffic as units of Mbps per hour on the day of viewing. |
| Top 5 OT Protocols | Displays a bar graph that details the top five most used OT protocols. The bar graph also provides the number of devices that are using each of those protocols. |
| Traffic By Port | Displays a pie chart showing the types of ports in your network, with the amount of traffic detected in each type of port. |
| Top open alerts | Displays a table listing any currently open alerts with high severity levels, including critical details about each alert. |
Select the link in each widget to drill down for more information in your sensor.
Validate connectivity status
Verify that your OT sensor is successfully connected to the Azure portal directly from the OT sensor's Overview page.
If there are any connection issues, a disconnection message is shown in the General Settings area on the Overview page, and a Service connection error warning appears at the top of the page in the ![]() System Messages area. For example:
System Messages area. For example:
Find more information about the issue by hovering over the ![]() information icon. For example:
information icon. For example:
Take action by selecting the Learn more option under ![]() System Messages. For example:
System Messages. For example:
Download software for OT sensors
You may need to download software for your OT sensor if you're installing Defender for IoT software on your own appliances, or updating software versions.
In Defender for IoT in the Azure portal, use one of the following options:
For a new installation, select Getting started > Sensor. Select a version in the Purchase an appliance and install software area, and then select Download.
If you're updating your OT sensor, use the options in the Sites and sensors page > Sensor update (Preview) menu.
All files downloaded from the Azure portal are signed by root of trust so that your machines use signed assets only.
For more information, see Update Defender for IoT OT monitoring software.
Upload a new activation file
Each OT sensor is onboarded as a cloud-connected or locally managed OT sensor and activated using a unique activation file. For cloud-connected sensors, the activation file is used to ensure the connection between the sensor and Azure.
You need to upload a new activation file to your sensor if you want to switch sensor management modes, such as moving from a locally managed sensor to a cloud-connected sensor, or if you're updating from a recent software version. Uploading a new activation file to your sensor includes deleting your sensor from the Azure portal and onboarding it again.
To add a new activation file:
Do one of the following:
Onboard your sensor from scratch:
In Defender for IoT on the Azure portal > Sites and sensors, locate and delete your OT sensor.
Select Onboard OT sensor > OT to onboard the sensor again from scratch and download the new activation file. For more information, see Onboard OT sensors.
Download the current sensor's activation file: On the Sites and sensors page, locate the sensor you just added. Select the three dots (...) on the sensor's row and select Download activation file. Save the file in a location accessible to your sensor.
All files downloaded from the Azure portal are signed by root of trust so that your machines use signed assets only.
Sign in to the Defender for IoT sensor console and select System Settings > Sensor management > Subscription & Activation Mode.
Select Upload and browse to the file that you downloaded from the Azure portal.
Select Activate to upload your new activation file.
Troubleshoot activation file upload
You'll receive an error message if the activation file couldn't be uploaded. The following events might have occurred:
The sensor can't connect to the internet: Check the sensor's network configuration. If your sensor needs to connect through a web proxy to access the internet, verify that your proxy server is configured correctly on the Sensor Network Configuration screen. Verify that the required endpoints are allowed in the firewall and/or proxy.
For OT sensors version 22.x, download the list of required endpoints from the Sites and sensors page on the Azure portal. Select an OT sensor with a supported software version, or a site with one or more supported sensors. And then select More actions > Download endpoint details. For sensors with earlier versions, see Sensor access to Azure portal.
The activation file is valid but Defender for IoT rejected it: If you can't resolve this problem, you can download another activation from the Sites and sensors page in the Azure portal. If this doesn't work, contact Microsoft Support.
Note
Activation files expire 14 days after creation. If you onboarded your sensor but didn't upload the activation file before it expired, download a new activation file.
Manage SSL/TLS certificates
If you're working with a production environment, you'd deployed a CA-signed SSL/TLS certificate as part of your OT sensor deployment. We recommend using self-signed certificates only for testing purposes.
The following procedures describe how to deploy updated SSL/TLS certificates, such as if the certificate has expired.
To deploy a CA-signed SSL/TLS certificate:
Sign into your OT sensor and select System Settings > Basic > SSL/TLS Certificate.
In the SSL/TLS Certificates pane, select the Import trusted CA certificate (recommended) option. For example:
Enter the following parameters:
Parameter Description Certificate Name Enter your certificate name. Passphrase - Optional Enter a passphrase. Private Key (KEY file) Upload a Private Key (KEY file). Certificate (CRT file) Upload a Certificate (CRT file). Certificate Chain (PEM file) - Optional Upload a Certificate Chain (PEM file). Select Use CRL (Certificate Revocation List) to check certificate status to validate the certificate against a CRL server. The certificate is checked once during the import process.
If an upload fails, contact your security or IT administrator. For more information, see SSL/TLS certificate requirements for on-premises resources and Create SSL/TLS certificates for OT appliances.
In the Validation of OT sensor certificate area, select Mandatory if SSL/TLS certificate validation is required. Otherwise, select None.
If you've selected Mandatory and validation fails, communication between relevant components is halted, and a validation error is shown on the sensor. For more information, see CRT file requirements.
Select Save to save your certificate settings.
Troubleshoot certificate upload errors
You won't be able to upload certificates to your OT sensors if the certificates aren't created properly or are invalid. Use the following table to understand how to take action if your certificate upload fails and an error message is shown:
| Certificate validation error | Recommendation |
|---|---|
| Passphrase does not match to the key | Make sure you have the correct passphrase. If the problem continues, try recreating the certificate using the correct passphrase. For more information, see Supported characters for keys and passphrases. |
| Cannot validate chain of trust. The provided Certificate and Root CA don't match. | Make sure a .pem file correlates to the .crt file. If the problem continues, try recreating the certificate using the correct chain of trust, as defined by the .pem file. |
| This SSL certificate has expired and isn't considered valid. | Create a new certificate with valid dates. |
| This certificate has been revoked by the CRL and can't be trusted for a secure connection | Create a new unrevoked certificate. |
| The CRL (Certificate Revocation List) location is not reachable. Verify the URL can be accessed from this appliance | Make sure that your network configuration allows the sensor to reach the CRL server defined in the certificate. For more information, see Verify CRL server access. |
| Certificate validation failed | This indicates a general error in the appliance. Contact Microsoft Support. |
Update the OT sensor network configuration
You'd configured your OT sensor network configuring during installation. You may need to make changes as part of OT sensor maintenance, such as to modify network values or setting up a proxy configuration.
To update the OT sensor configuration:
Sign into the OT sensor and select System Settings > Basic > Sensor network settings.
In the Sensor network settings pane, update the following details for your OT sensor as needed:
- IP address. Changing the IP address may require users to sign into your OT sensor again.
- Subnet mask
- Default gateway
- DNS. Make sure to use the same hostname that's configured in your organization's DNS server.
- Hostname (optional)
Toggle the Enable Proxy option on or off if needed. If you're using a proxy, enter following values:
- Proxy host
- Proxy port
- Proxy username (optional)
- Proxy password (optional)
Select Save to save your changes.
Turn off learning mode manually
A Microsoft Defender for IoT OT network sensor starts monitoring your network automatically as soon as it's connected to your network and you've signed in. Network devices start appearing in your device inventory, and alerts are triggered for any security or operational incidents that occur in your network.
Initially, this activity happens in learning mode, which instructs your OT sensor to learn your network's usual activity, including the devices and protocols in your network, and the regular file transfers that occur between specific devices. Any regularly detected activity becomes your network's baseline traffic.
This procedure describes how to turn off learning mode manually when the current alerts accurately reflect your network activity.
To turn off learning mode:
Sign into your OT network sensor and select System settings > Network monitoring > Detection engines and network modeling.
Toggle off one or both of the following options:
Learning. Toggle off this option about two-six weeks after you've deployed your sensor, when you feel that the OT sensor detections accurately reflect your network activity.
Smart IT Learning. Keep this option toggled on to keep the number of nondeterministic alerts and notifications low.
Nondeterministic behavior includes changes that are the result of normal IT activity, such as DNS and HTTP requests. Toggling off the Smart IT Learning option can trigger many false positive policy violation alerts.
In the confirmation message, select OK, and then select Close to save your changes.
Update a sensor's monitoring interfaces (configure ERSPAN)
You may want to change the interfaces used by your sensor to monitor traffic. You originally configured these details as part of your initial sensor setup, but may need to modify the settings as part of system maintenance, such as configuring ERSPAN monitoring.
For more information, see ERSPAN ports.
Note
This procedure restarts your sensor software to implement any changes made.
To update your sensor's monitoring interfaces:
Sign into your OT sensor and select System settings > Basic > Interface connections.
In the grid, locate the interface you want to configure. Do any of the following:
Select the Enable/Disable toggle for any interfaces you want the sensor to monitor. You must have at least one interface enabled for each sensor.
If you're not sure about which interface to use, select the
 Blink physical interface LED button to have the selected port blink on your machine.
Tip
We recommend that you optimize performance on your sensor by configuring your settings to monitor only the interfaces that are actively in use.
For each interface you select to monitor, select the
 Advanced settings button to modify any of the following settings:
Name Description Mode Select one of the following:
- SPAN Traffic (no encapsulation) to use the default SPAN port mirroring.
- ERSPAN if you're using ERSPAN mirroring.
For more information, see Choose a traffic mirroring method for OT sensors.Description Enter an optional description for the interface. You'll see this later on in the sensor's System settings > Interface configurations page, and these descriptions may be helpful in understanding the purpose of each interface. Auto negotiation Relevant for physical machines only. Use this option to determine which sort of communication methods are used, or if the communication methods are automatically defined between components.
Important: We recommend that you change this setting only on the advice of your networking team.
For example:
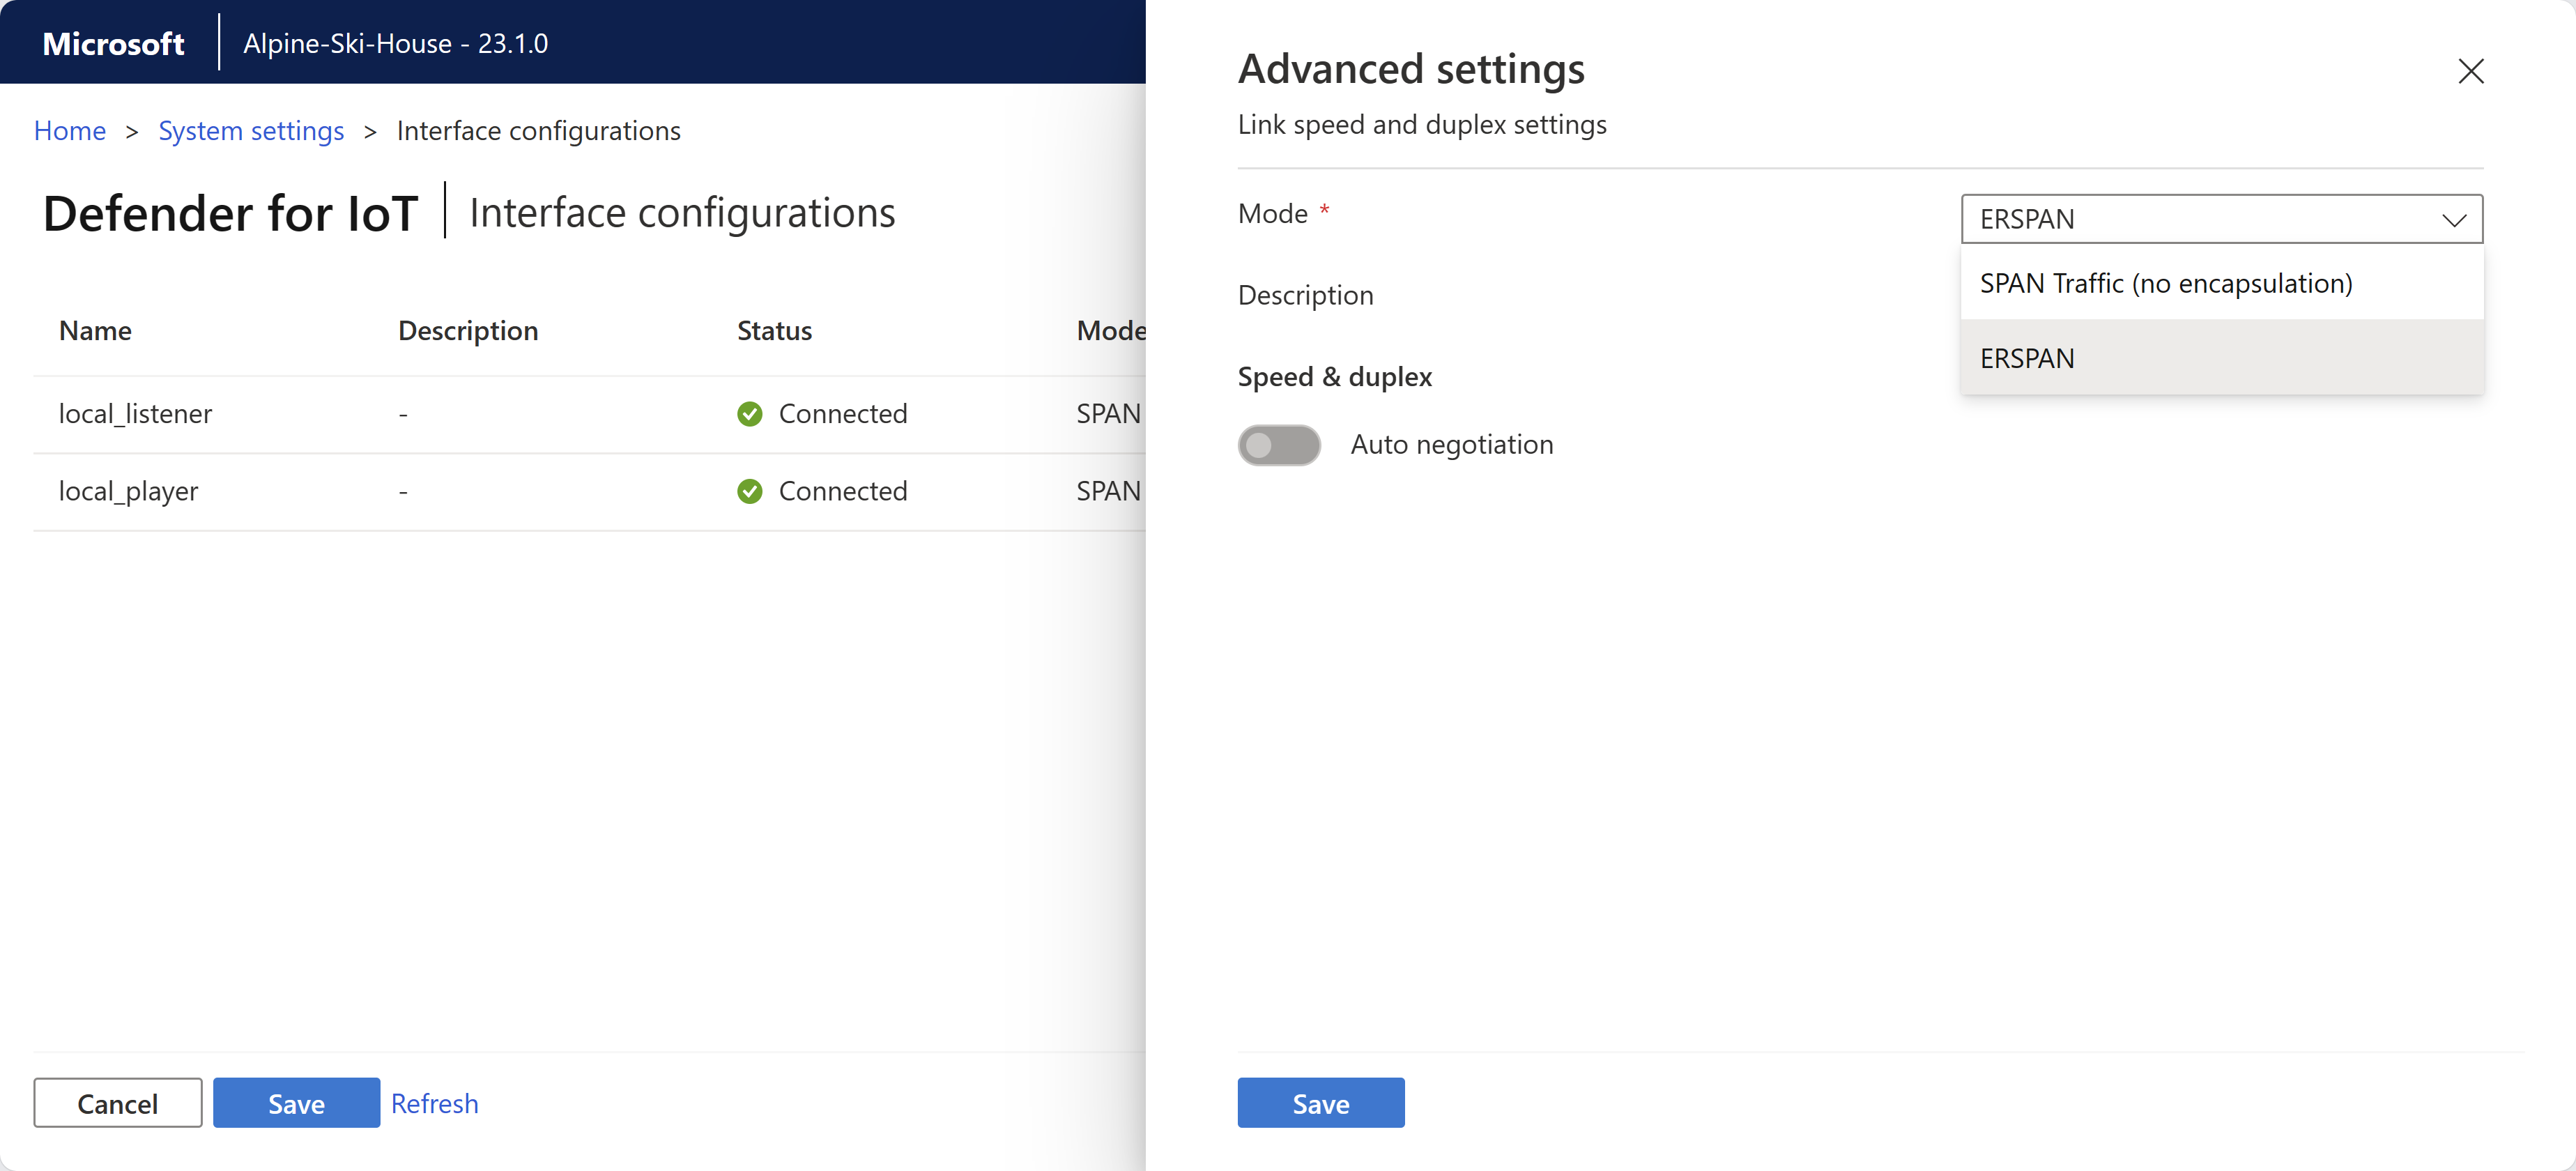
Select Save to save your changes. Your sensor software restarts to implement your changes.
Synchronize time zones on an OT sensor
You may want to configure your OT sensor with a specific time zone so that all users see the same times regardless of the user's location.
Time zones are used in alerts, trends and statistics widgets, data mining reports, risk assessment reports, and attack vector reports.
To configure an OT sensor's time zone:
Sign into your OT sensor and select System settings > Basic > Time & Region.
In the Time & Region pane, enter the following details:
Time Zone: Select the time zone you want to use
Date Format: Select the time and date format you want to use. Supported formats include:
dd/MM/yyyy HH:mm:ssMM/dd/yyyy HH:mm:ssyyyy/MM/dd HH:mm:ss
The Date & Time field is automatically updated with the current time in the format you'd selected.
Select Save to save your changes.
Configure SMTP mail server settings
Define SMTP mail server settings on your OT sensor so that you configure the OT sensor to send data to other servers and partner services.
You need an SMTP mail server configured to enable email alerts about disconnected sensors, failed sensor backup retrievals, and SPAN monitoring port failures from the OT sensor, and to set up mail forwarding and configure forwarding alert rules.
Prerequisites:
Make sure you can reach the SMTP server from the sensor's management port.
To configure an SMTP server on your OT sensor:
Sign in to the OT sensor and select System settings > Integrations > Mail server.
In the Edit Mail Server Configuration pane that appears, define the values for your SMTP server as follows:
Parameter Description SMTP Server Address Enter the IP address or domain address of your SMTP server. SMTP Server Port Default = 25. Adjust the value as needed. Outgoing Mail Account Enter an email address to use as the outgoing mail account from your sensor. SSL Toggle on for secure connections from your sensor. Authentication Toggle on and then enter a username and password for your email account. Use NTLM Toggle on to enable NTLM. This option only appears when you have the Authentication option toggled on. Select Save when you're done.
Upload and play PCAP files
When troubleshooting your OT sensor, you may want to examine data recorded by a specific PCAP file. To do so, you can upload a PCAP file to your OT sensor and replay the data recorded.
The Play PCAP option is enabled by default in the sensor console's settings.
Maximum size for uploaded files is 2 GB.
To show the PCAP player in your sensor console:
On your sensor console, go to System settings > Sensor management > Advanced Configurations.
In the Advanced configurations pane, select the Pcaps category.
In the configurations displayed, change
enabled=0toenabled=1, and select Save.
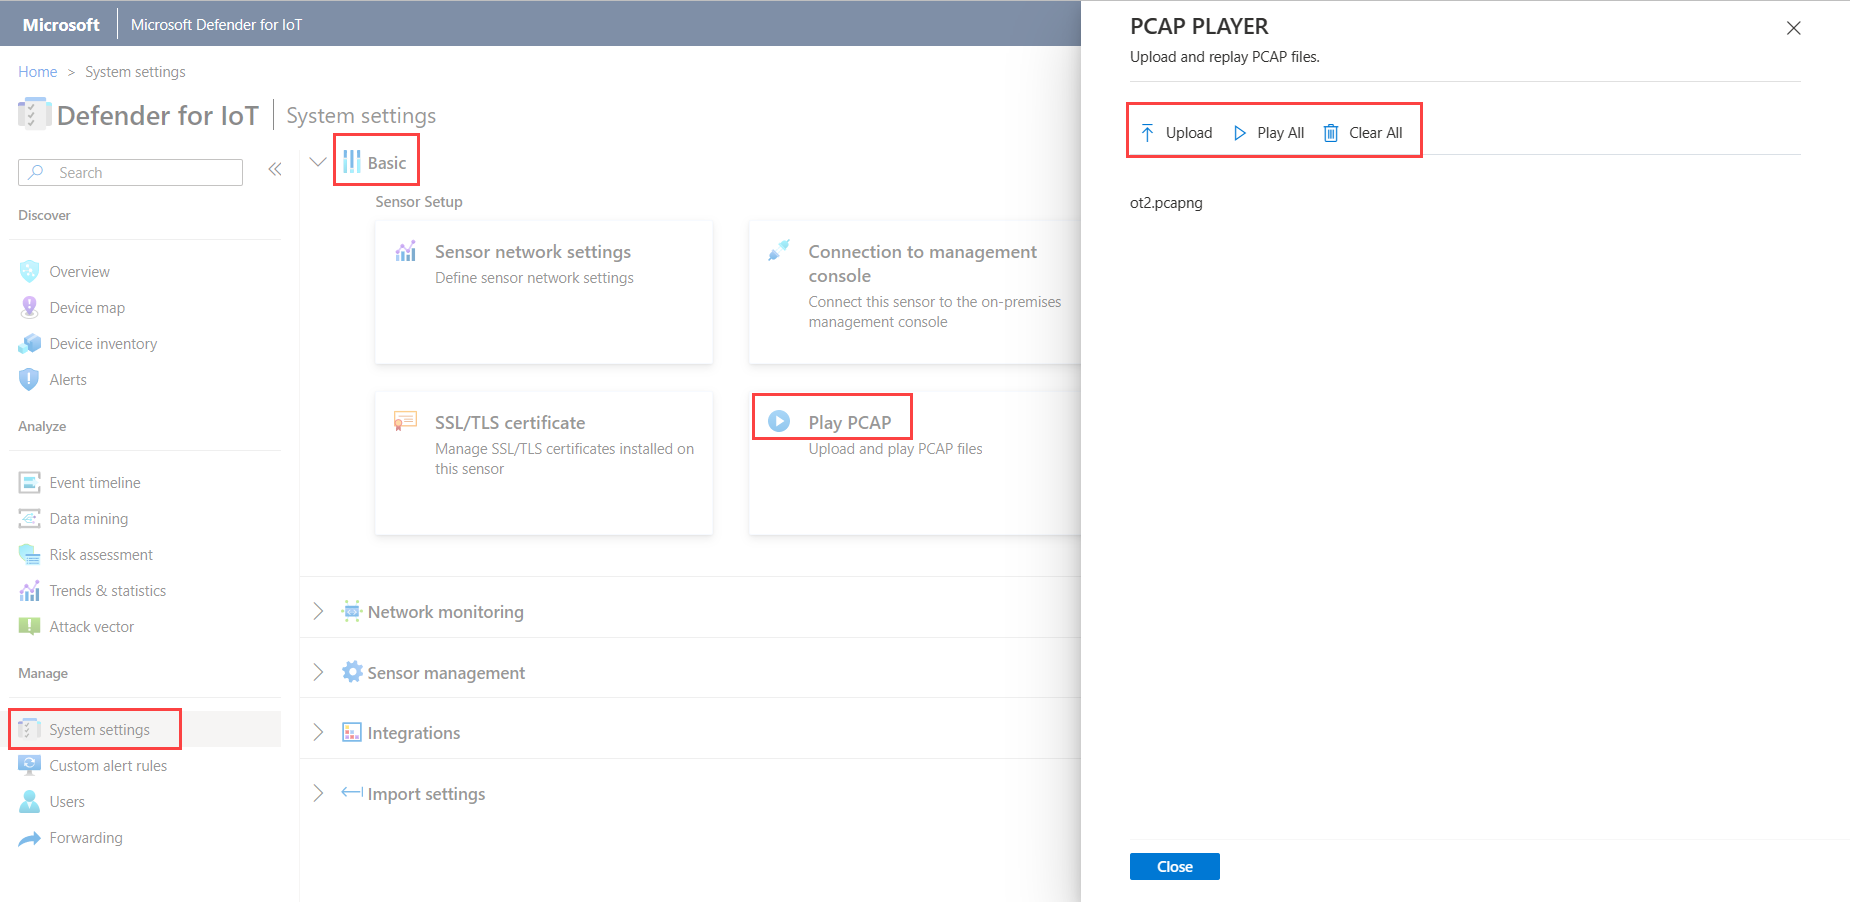
The Play PCAP option is now available in the sensor console's settings, under: System settings > Basic > Play PCAP.
To upload and play a PCAP file:
On your sensor console, select System settings > Basic > Play PCAP.
In the PCAP PLAYER pane, select Upload and then navigate to and select the file or multiple files you want to upload.
Select Play to play your PCAP file, or Play All to play all PCAP files currently loaded.
Tip
Select Clear All to clear the sensor of all PCAP files loaded.
Turn off specific analytics engines
By default, each OT network sensor analyzes ingested data using built-in analytics engines, and triggers alerts based on both real-time and prerecorded traffic.
While we recommend that you keep all analytics engines on, you may want to turn off specific analytics engines on your OT sensors to limit the type of anomalies and risks monitored by that OT sensor.
Important
When you disable a policy engine, information that the engine generates won't be available to the sensor. For example, if you disable the Anomaly engine, you won't receive alerts on network anomalies. If you'd created a forwarding alert rule, anomalies that the engine learns won't be sent.
To manage an OT sensor's analytics engines:
Sign into your OT sensor and select System settings > Network monitoring > Customization > Detection engines and network modeling.
In the Detection engines and network modeling pane, in the Engines area, toggle off one or more of the following engines:
- Protocol Violation
- Policy Violation
- Malware
- Anomaly
- Operational
Toggle the engine back on to start tracking related anomalies and activities again.
For more information, see Defender for IoT analytics engines.
Select Close to save your changes.
To manage analytics engines from an OT sensor:
Sign into your OT sensor and select System Settings.
In the Sensor Engine Configuration section, select one or more OT sensors where you want to apply settings, and clear any of the following options:
- Protocol Violation
- Policy Violation
- Malware
- Anomaly
- Operational
Select SAVE CHANGES to save your changes.
Clear OT sensor data
If you need to relocate or erase your OT sensor, reset it to clear all detected or learned data on the OT sensor.
After clearing data on a cloud-connected sensor:
- The device inventory on the Azure portal is updated in parallel.
- Some actions on corresponding alerts in the Azure portal are no longer supported, such as downloading PCAP files or learning alerts.
Note
Network settings such as IP/DNS/GATEWAY will not be changed by clearing system data.
To clear system data:
Sign in to the OT sensor as the admin user. For more information, see Default privileged on-premises users.
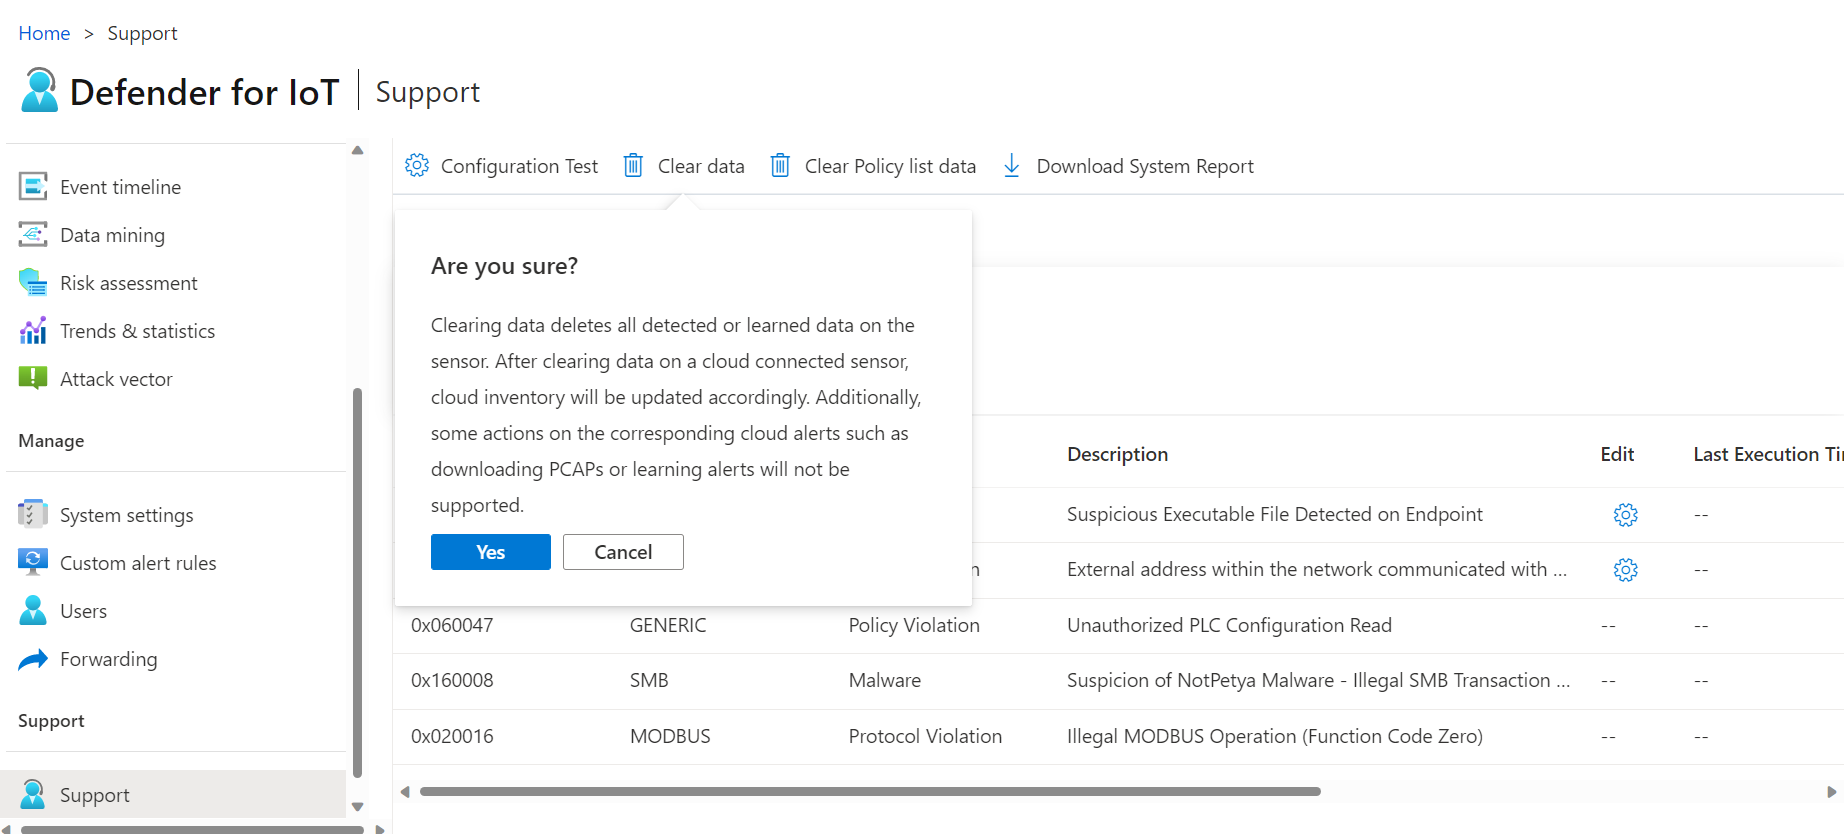
Select Support > Clear data.
In the confirmation dialog box, select Yes to confirm that you do want to clear all data from the sensor and reset it. For example:
A confirmation message appears that the action was successful. All learned data, allowlists, policies, and configuration settings are cleared from the sensor.
Manage sensor plugins and monitor plugin performance
View data for each protocol monitored by your sensor using the Protocols DPI (Horizon Plugins) page in the sensor console.
Sign into your OT sensor console and select System settings > Network monitoring > Protocols DPI (Horizon Plugins).
Do one of the following:
To limit the protocols monitored by your sensor, select the Enable/Disable toggle for each plugin as needed.
To monitor plugin performance, view the data shown on the Protocols DPI (Horizon Plugins) page for each plugin. To help locate a specific plugin, use the Search box to enter part or all of a plugin name.
The Protocols DPI (Horizon Plugins) lists the following data per plugin:
| Column name | Description |
|---|---|
| Plugin | Defines the plugin name. |
| Type | The plugin type, including APPLICATION or INFRASTRUCTURE. |
| Time | The time that data was last analyzed using the plugin. The time stamp is updated every five seconds. |
| PPS | The number of packets analyzed per second by the plugin. |
| Bandwidth | The average bandwidth detected by the plugin within the last five seconds. |
| Malforms | The number of malform errors detected in the last five seconds. Malformed validations are used after the protocol has been positively validated. If there's a failure to process the packets based on the protocol, a failure response is returned. |
| Warnings | The number of warnings detected, such as when packets match the structure and specifications, but unexpected behavior is detected, based on the plugin warning configuration. |
| Errors | The number of errors detected in the last five seconds for packets that failed basic protocol validations for the packets that match protocol definitions. |
Log data is available for export in the Dissection statistics and Dissection Logs, log files. For more information, see Export troubleshooting logs.
Next steps
For more information, see:
