Display an actual execution plan
Applies to:
SQL Server
Azure SQL Database
Azure SQL Managed Instance
SQL database in Microsoft Fabric
This article describes how to generate actual graphical execution plans by using SQL Server Management Studio. Actual execution plans are generated after the T-SQL queries or batches execute. Because of this, an actual execution plan contains runtime information, such as actual resource usage metrics and runtime warnings (if any). The execution plan that is generated displays the actual query execution plan that the SQL Server Database Engine used to execute the queries.
To use this feature, users must have the appropriate permissions to execute the Transact-SQL queries for which a graphical execution plan is being generated, and they must be granted the SHOWPLAN permission for all databases referenced by the query.
Note
To retrieve an actual execution plan for dedicated SQL pools (formerly SQL DW) and dedicated SQL pools in Azure Synapse Analytics, there are different commands. For more information, see Monitor your Azure Synapse Analytics dedicated SQL pool workload using DMVs.
Include an execution plan for a query during execution
On the SQL Server Management Studio toolbar, select Database Engine Query. You can also open an existing query and display the estimated execution plan by selecting the Open File toolbar button and locating the existing query.
Enter the query for which you would like to display the actual execution plan.
On the Query menu, select Include Actual Execution Plan or select the Include Actual Execution Plan toolbar button.
Execute the query by selecting the Execute toolbar button. The plan used by the query optimizer is displayed on the Execution Plan tab in the results pane.
Pause the mouse over the logical and physical operators to view the description and properties of the operators in the displayed ToolTip, including properties of the overall execution plan, by selecting the root node operator (the SELECT node in the picture above).
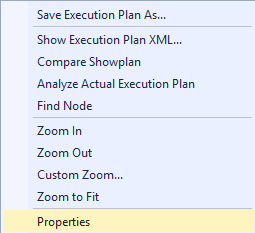
Alternatively, you can view operator properties in the Properties window. If Properties isn't visible, right-click an operator and select Properties. Select an operator to view its properties.

You can alter the display of the execution plan by right-clicking the execution plan and selecting Zoom In, Zoom Out, Custom Zoom, or Zoom to Fit. Zoom In and Zoom Out allow you to zoom in or out on the execution plan, while Custom Zoom allows you to define your own zoom, such as zooming at 80 percent. Zoom to Fit magnifies the execution plan to fit the result pane. Alternatively, use a combination of the CTRL key and your mouse wheel to activate dynamic zoom.
To navigate the display of the execution plan, use the vertical and horizontal scroll bars, or select and hold on any blank area of the execution plan, and drag your mouse. Alternatively, select and hold the plus (+) sign in the right lower corner of the execution plan window, to display a miniature map of the entire execution plan.
Note
Alternatively, use SET STATISTICS XML to return execution plan information for each statement after executing it. If used in SQL Server Management Studio, the Results tab will have a link to open the execution plan in graphical format.
For more information, see Query Profiling Infrastructure.

