Tutorial: Debug C++ code with Visual Studio
This article introduces features of the Visual Studio debugger in a step-by-step walkthrough. When you debug an application, you usually run your app with the debugger attached. The debugger provides many ways to examine what your code is doing during program execution. You can step through your code and look at values stored in variables and set watches on variables to see when values change. The debugger helps you examine the execution path of your code and confirm a branch of code is running.
In this tutorial, you:
- Start the debugger and pause at breakpoints
- Learn commands to step through code in the debugger
- Inspect variables in data tips and debugger windows
- Examine the call stack
If you're new to debugging, you might want to read Debugging for absolute beginners before you start this tutorial. If you want a higher-level view of the debugger features, see First look at the debugger.
Prerequisites
Visual Studio 2022 version 17.12 or later with the Desktop development with C++ workload installed.
- To install Visual Studio 2022 for free, go to the Visual Studio downloads page.
- To install Visual Studio for free, go to the Release and Build History page to learn more.
If you already have Visual Studio, you can install the workload from within the Interactive Development Environment (IDE):
Select Tools > Get Tools and Features.
In the Visual Studio Installer, select the Workloads tab.
Select the Desktop development with C++ workload, and then select Modify.
Follow the prompts and complete the installation.
This tutorial uses a C++ demo application and the screenshots present C++ syntax. Most of the demonstrated features are also applicable to C#, Visual Basic, F#, Python, JavaScript, and other languages supported by Visual Studio. There are a few limitations to keep in mind:
F#: The Edit-and-continue feature isn't supported.
F# and JavaScript: The Autos window isn't supported.
Create a project
Follow these steps to create a C++ console application project in Visual Studio. The project type provides all the template files you need to get started quickly:
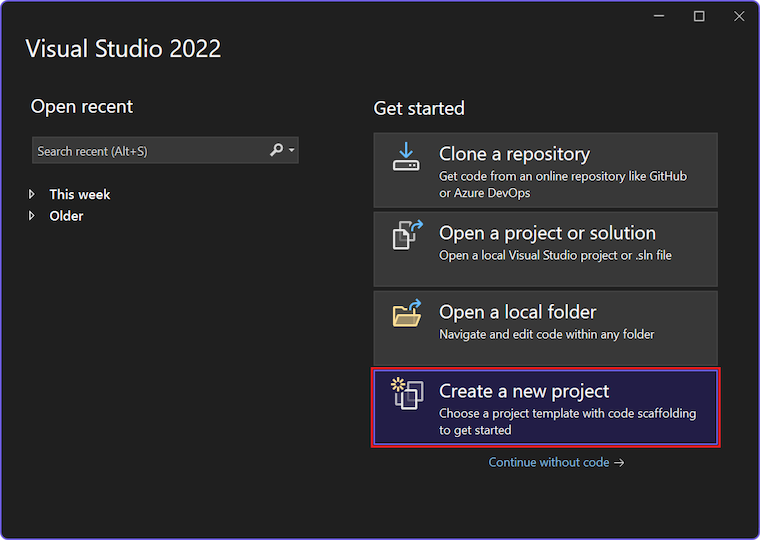
In the Visual Studio Start window (File > Start Window), select Create a new project:
Set the Language filter to C++ and set the Platform filter to Windows.
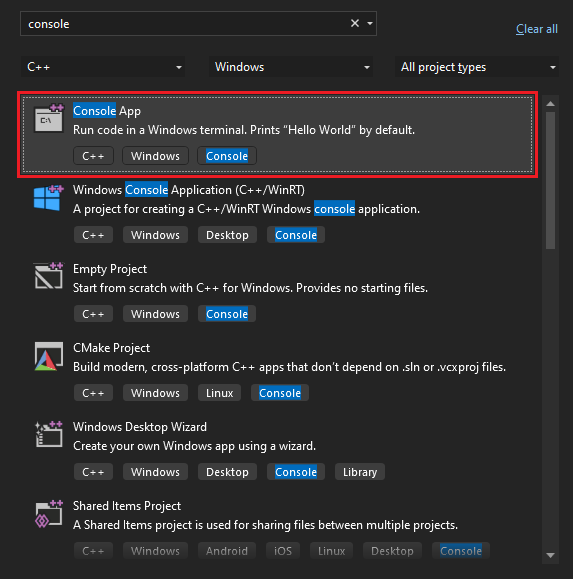
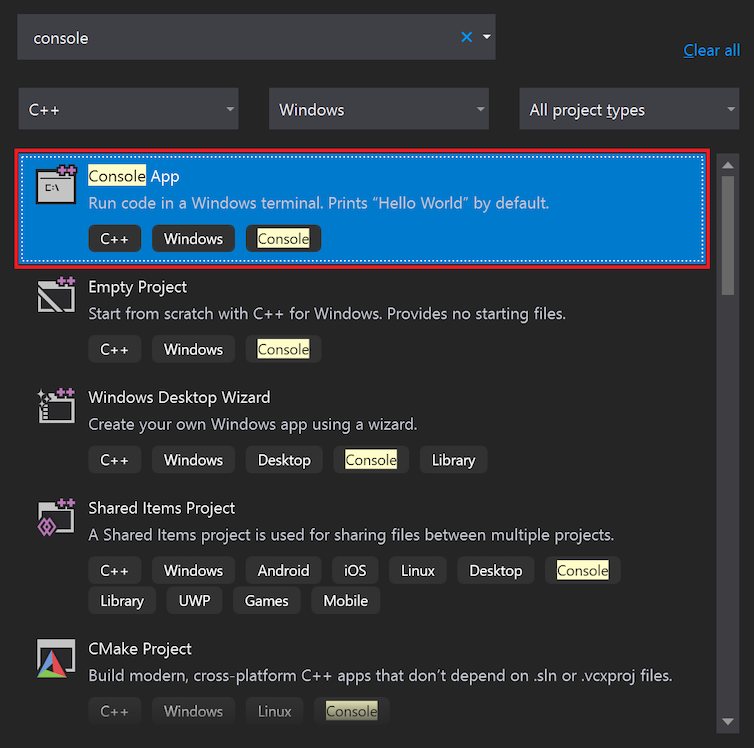
In the Search box, enter console, and select the Console App template in the list of results:
Note
If you don't see the Console App template, you can install it from the Create a new project window. Locate the Not finding what you're looking for? section that follows the search results and select Install more tools and features. In the Visual Studio Installer, select the Desktop development with C++ workload and update your installation. For more information, see the Prerequisites section.
Select Next to continue to the configuration page.
Enter get-started-debugging as the Project name and Solution name for your new app. Choose the default Location or browse to a different path in your environment.
Select Create to create the new Node.js project.
Visual Studio creates your new project and opens your project hierarchy in Solution Explorer. The get-started-debugging.cpp file is open in the code editor.
Create the application
Create a new application for your project by editing the get-started-debugging.cpp file in the code editor.
Replace the default content provided by the template with the following code:
#include <string>
#include <vector>
#include <iostream>

void SendMessage(const std::wstring& name, int msg)
{
   std::wcout << L"Hello, " << name << L"! Count to " << msg << std::endl;
}

int main()
{
   std::vector<wchar_t> letters = { L'f', L'r', L'e', L'd', L' ', L's', L'm', L'i', L't', L'h' };
   std::wstring name = L"";
   std::vector<int> a(10);
   std::wstring key = L"";

   for (int i = 0; i < letters.size(); i++)
   {
      name += letters[i];
      a[i] = i + 1;
      SendMessage(name, a[i]);
   }
   std::wcin >> key;
   return 0;
}
Start the debugger
Now you're ready to start debugging your updated code:
Start the debugging session by selecting F5 or Debug > Start Debugging. You can also select Start Debugging
 (solid green arrow icon) in the Debug toolbar.
The F5 keyboard shortcut starts the application with the debugger attached to the app process, but you don't yet have anything special to examine in the code. The app simply loads and you see the console output:
Hello, f! Count to 1
Hello, fr! Count to 2
Hello, fre! Count to 3
Hello, fred! Count to 4
Hello, fred ! Count to 5
Hello, fred s! Count to 6
Hello, fred sm! Count to 7
Hello, fred smi! Count to 8
Hello, fred smit! Count to 9
Hello, fred smith! Count to 10
Later in the tutorial, you look more closely at this app in the debugger and explore other debugging features.
Halt the debugger by selecting Stop
 (red square icon) in the Debug toolbar. You can also use the Shift + F5 keyboard shortcut.
In the console window for the running application, select any key and then select Enter to close the window.
Set a breakpoint and start the debugger
Try setting a breakpoint and pausing at the selected point in the debugger:
Return to the get-started-debugging.cpp file in the code editor, and locate the
forloop of themainfunction:for (int i = 0; i < letters.size(); i++) { name += letters[i]; a[i] = i + 1; SendMessage(name, a[i]); }Set a breakpoint on the line that contains the code statement
name += letters[i];by selecting in the left gutter on the line for the statement. Visual Studio adds a red circle in the gutter to indicate the set breakpoint.
Tip
You can also place your cursor on a line of code and select F9 to toggle the breakpoint for that line.
Breakpoints are one of the most basic and essential features of reliable debugging. A breakpoint indicates where you want Visual Studio to suspend your running code. When the execution is paused, you can take a look at the values of variables, examine the behavior of memory, or check if a branch of code is getting run.
Start your app in the debugger by selecting F5 or Start Debugging.
Visual Studio starts execution of your app. When the debugger reaches your set breakpoint, the debugging process pauses.
Visual Studio adds a yellow arrow to the red breakpoint circle in the gutter to represent the code statement where the debugger is paused. Program execution is paused and the indicated statement is waiting to be processed.

Note
The F5 action is relative to the current execution state of your application. If your app isn't running and you select F5, the debugger starts your app and continues execution until it reaches the first set breakpoint. This behavior maps to the Debug > Start Debugging command. If your app is already running and you select F5, app execution continues until the debugger reaches the next breakpoint or end of program. This behavior maps to the Debug > Continue command.
Breakpoints are a useful feature when you know the line of code or section of code that you want to examine in detail. For information on the different types of breakpoints you can set, such as conditional breakpoints, see Use the right type of breakpoint.
Step through your code in the debugger
A convenient way to browse your code in the debugger is to use step commands. These commands let you Step Into, Step Over, and Step Out of a section of code, and also Step Backward in app execution.

The following procedure highlights how to use keyboard shortcuts with step commands to quickly work through your code. (The equivalent menu actions are shown in parenthesis.)
Start your app in the debugger by selecting F5 or Start Debugging.
While the debugger is paused in the
forloop in themainfunction, select F11 (Debug > Step Into) twice to advance to theSendMessagemethod call.After you select F11 twice, execution continues to the code statement
SendMessage(name, a[i]);.Select F11 again to step into the
SendMessagemethod.Notice that the yellow pointer advances into the
SendMessagemethod:
The F11 keyboard shortcut initiates the Step Into command, which advances app execution one statement at a time. It's a good way to examine the execution flow in the most detail. By default, the debugger skips over nonuser code. For more information, see Just My Code. Later in the tutorial, you learn ways to move faster through your code.
After you examine the
SendMessagemethod, you can continue debugging with the Step Out command. Select Shift + F11 (Debug > Step Out).This command resumes app execution (and advances the debugger) until the current method or function returns.
When the command completes, the debugger pauses in the
forloop of themainmethod at theSendMessagemethod call.Select F11 several times until you return again to the
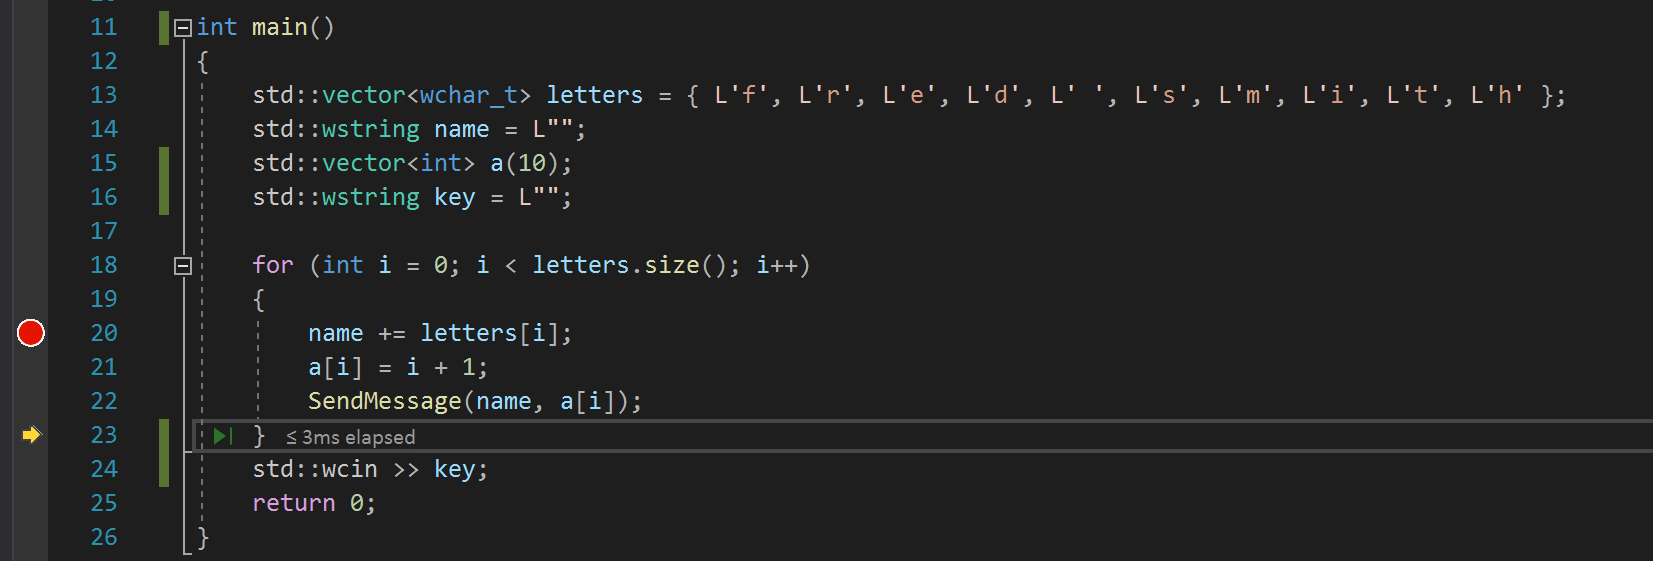
SendMessagemethod call.While the debugger is paused at the method call, select F10 (Debug > Step Over).
Notice this time that the debugger doesn't step into the
SendMessagemethod. The F10 shortcut advances the debugger without stepping into functions or methods in your app code (the code still executes). When you select F10 on theSendMessagemethod call (instead of F11), you Step Over the implementation code forSendMessage. This approach is useful to move past code that you don't need to currently inspect. For more information on different ways to move through your code, see Navigate code in the debugger.
Browse your code with Run to Click
Another way to work through your code in the debugger is with the Run to Click feature. This action is similar to setting a temporary breakpoint.
Continue with your debugging session:
Select F5 to advance to the breakpoint in your code.
In the code editor, scroll to the
SendMessagemethod definition, and hover over thestd::wcoutfunction.Hover until the Run to Click
 (green arrow icon) appears to the left of the code statement. If you hover over the icon, you see the tooltip "Run execution to here":
Select Run to Click
 .
.The debugger advances execution to the indicated position. In this example, the debugger reaches the call to the
std::wcoutfunction.
The Run to Click action is handy for getting around quickly within a visible region of app code. You can use the feature in any file open in the code editor.
Restart your app quickly
Quickly restart your app by selecting Restart  (circular arrow icon) in the Debug Toolbar. You can also select Debug > Restart or use the Ctrl + Shift + F5 keyboard shortcut.
The Restart feature is more efficient than stopping the app and starting the debugger again.
When you select Restart, the debugger pauses at the first breakpoint it encounters during execution. In this example, the debugger stops again at the breakpoint you set inside the for loop.
Inspect variables with data tips
Features that help you inspect variables are one of the most useful benefits of working with the debugger. Often, when you're debugging an issue, you're trying to discover whether variables are storing expected values at particular times. Visual Studio provides several ways to help you complete this task.
Continue with your debugging session:
While the debugger is paused on the
name += letters[i]statement, hover over thelettersvariable. Select the expand/collapse arrow to the left of the variable name and view its properties in the flyout menu.The data tips feature shows all the elements that the variable contains. Notice the default value,
size={10}: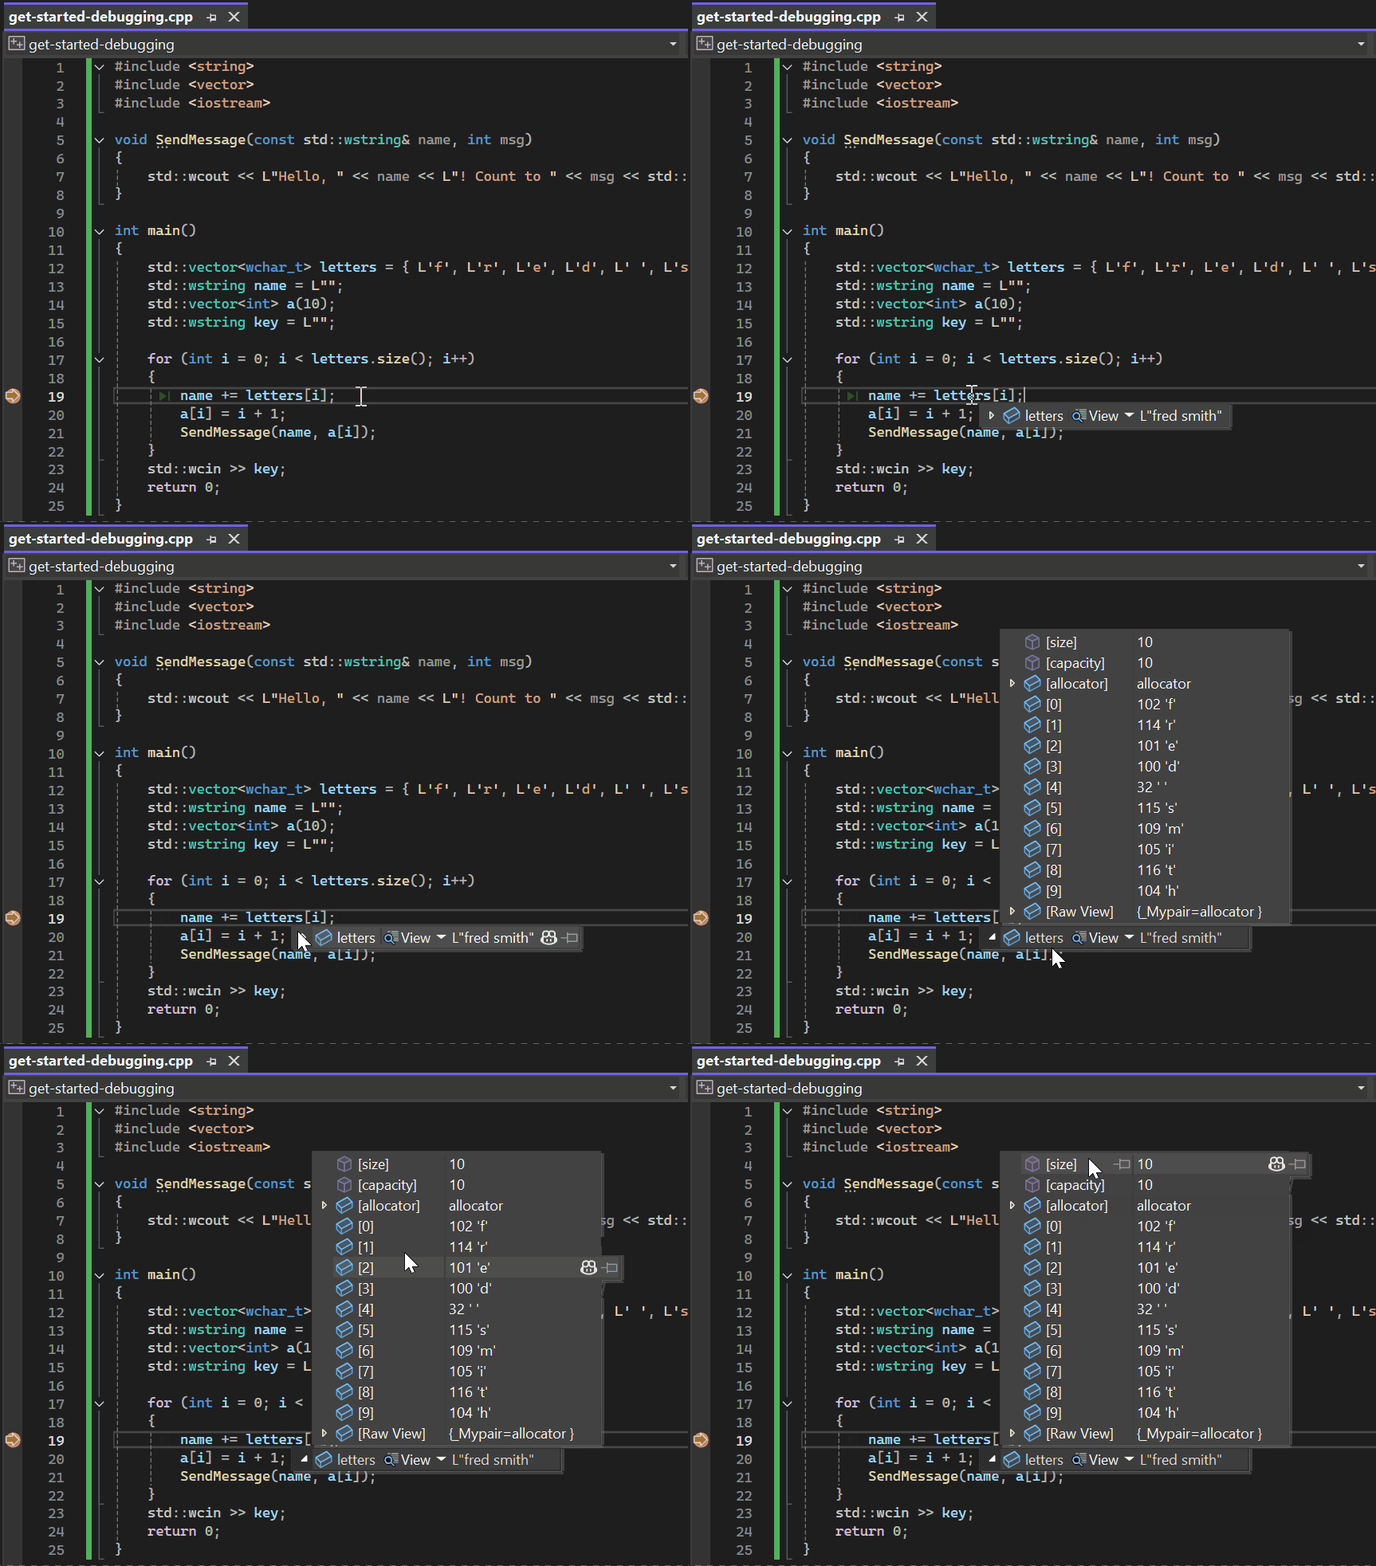
Next, hover over the
namevariable and notice its current value, an empty string ("").Select F5 (Debug > Continue) a few times to iterate several times through the
forloop. Each time the debugger pauses at the breakpoint, hover over thenamevariable and check the current value:
The value of the variable changes with each iteration of the
forloop, showing values off, thenfr, thenfre, and so on.
Inspect variables with the Autos and Locals windows
Another approach for inspecting variables and values is by using the Autos and Locals windows. By default, these windows appear below the code editor in the Visual Studio IDE while you're debugging your app:
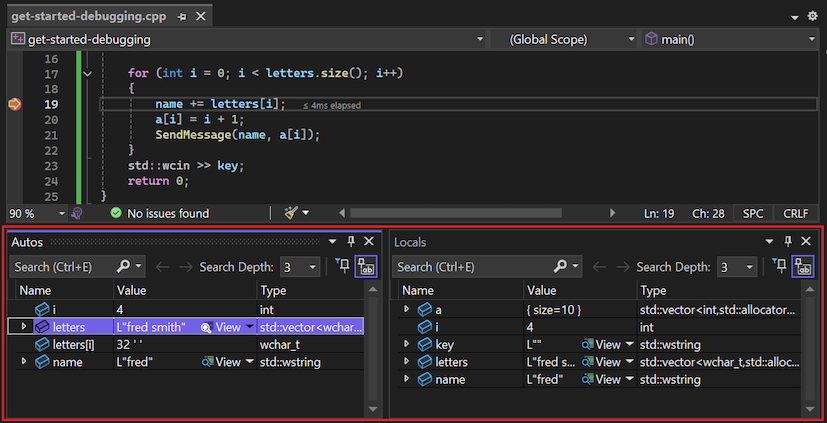
Notice the Autos window below the code editor.
If you don't see the window during your debugging session, select Debug > Windows > Autos to open the window.
The Autos window shows all variables used on the current line or the preceding line along with their current value. Keep in mind that specific programming languages can demonstrate unique behavior for variables and properties. For more information, see the Visual Studio Language Guidance.
Next, take a look at the Locals window. By default, this window is aligned next to the Autos window.
If you don't see the window during your debugging session, select Debug > Windows > Locals to open the window
In the Locals window, expand the
lettersvariable to show the elements that it contains.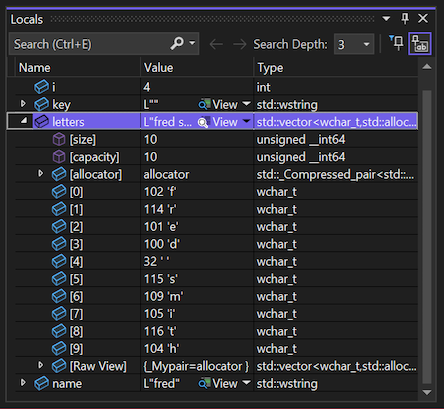
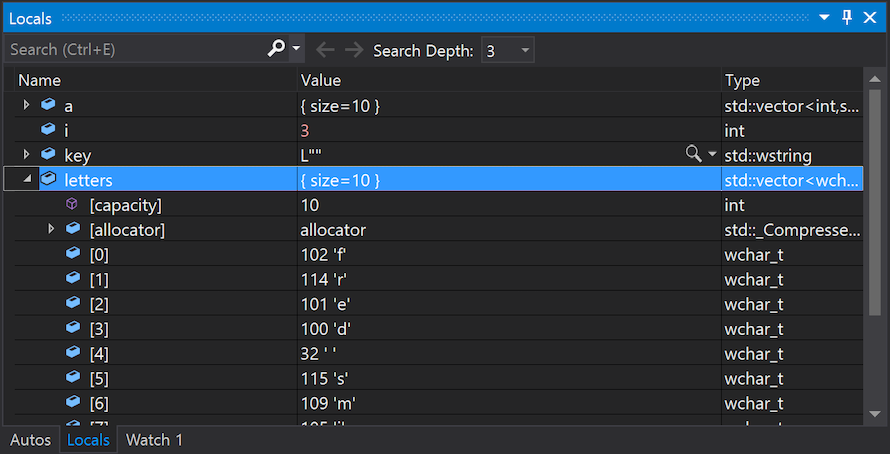
The Locals window shows you the variables that are in the current scope, that is, the current execution context.
Watch a variable
If you're interested in watching the behavior of a specific variable, you can set a watch:
In the code editor, right-click the name variable and select Add Watch. The Watch window opens below the code editor. You can use a Watch window to specify a variable (or an expression) that you want to track.
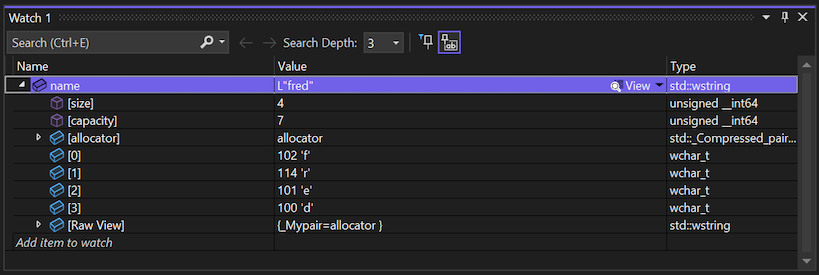
As you watch the name variable during app execution in the debugger, you can see its value change. Unlike the other variable windows, the Watch window always shows the variables that you're watching. When a watched variable isn't in scope, the variable name is dimmed.
Examine the call stack
The Call Stack window in Visual Studio shows the order in which methods and functions are called. This window is similar to the Debug perspective in some IDEs like Eclipse. By default, the call stack is visible in the lower right pane during the debugging session below the code editor.
While the debugger is paused in the
forloop, select the Call Stack window to see the current calling structure.If you don't see the window during your debugging session, select Debug > Windows > Call Stack to open the window.
Select F11 (Debug > Step Into) a few times until you see the debugger pause in the
SendMessagemethod.Look at the Call Stack window again:

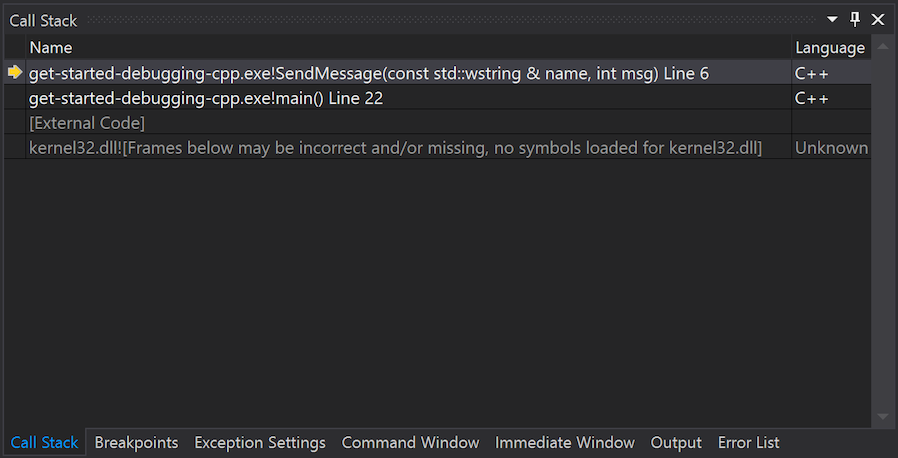
In the Call Stack window, the top line shows the current function (the
SendMessagemethod in this app). The second line shows that theSendMessagemethod was called from themainmethod, and so on.
The call stack is a good way to examine and understand the execution flow of an app:
Double-click a line of code to browse to the source code. This action also changes the current scope under inspection by the debugger, but it doesn't advance the debugger.
Access right-click menus for programming elements in the Call Stack window. For example, you can insert breakpoints into specified functions, advance the debugger by using Run to Cursor, and browse to source code. For more information, see View the call stack and use the Call Stack window in the debugger.
Change the execution flow
Another feature of the debugger in Visual Studio is the ability to change the execution flow of your app:
Select F11 (Debug > Step Into) twice to run the
std::wcoutfunction.While the debugger is paused in the
SendMessagemethod call, select and drag the yellow arrow (the execution pointer) to the left of the variable and move the arrow to the previous code statement,std::wcout.Select F11 again.
The debugger reruns the
std::wcoutfunction. You can track the process in the terminal output.By changing the execution flow, you can do things like test different code execution paths or rerun code without restarting the debugger.
Caution
Pay careful attention when working with this feature. When you select the yellow arrow, Visual Studio displays a warning in the tooltip indicating that the execution change can have unintended consequences. You might see other warnings as well, depending on your scenario. Keep in mind that moving the pointer can't revert your application to an earlier app state.
Select F5 to complete app execution.