Tools @ Performance Analysis of Logs
I´ve decided to start a new section in my blog around tools I use that help me a lot in my daily work. But first I want to give a big thanks to everyone that has projects under CodePlex because there are a lot of excellent projects there and for the time you guys take from yourself in helping the community free of charge J.
Today I will talk about PAL (Performance Analysis of Logs). This wonderful tool can be downloaded at https://www.codeplex.com/PAL .
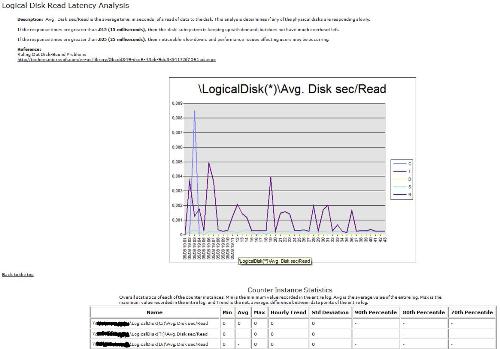
There are a lot of situations where we collect performance counters to help in troubleshooting issues and all of you that use them know the pain that is to look at all those counters collected overtime and then having to relate them to try to find the right path. PAL gives an excellent first view of this information in one very nice report. The tool is actually very simple to run (almost NEXT … NEXT … NEXT). The report that it generates is something like the picture below (in my sample I will show you one counter)

It is divided into three sections:
1. Brief description of the counter and thresholds
2. Graph showing the behavior
3. Details for each counter instance and it will show green, yellow and red colors in each line of this table according to the defined thresholds
Have fun.
Bruno