Troubleshoot a Windows bluescreen, a.k.a bugcheck, a.k.a blue screen of death
I have read a lot of posts in multiple forums on the internet where people ask "My machine keeps bluescreen-ining, what do I do?"... a common response is "Reinstall Windows and the problem will most likely go away". This is a wrong answer because if you simply reinstall Windows you don't know what caused the blue screen and if you don't know what caused it you cannot prevent it from happening again. So the correct answer is: find out what driver is causing the blue screen and then either a) stop using the driver or b) call your PC/device manufacturer and ask them for a fixed driver.
This post summarizes what a technically savvy user can do to troubleshoot and mitigate a bluescreen on his Windows PC.
Here are the quick steps:
1. Install the Windows Debugger
2. Load C:\Windows\MEMORY.DMP in the debugger
3. Load the debugging symbols for the crashing OS
4. Issue the '!analyze -v' command and read the output. It will tell you what driver caused the crash among many other useful things it will reveal.
Here is the long version:
What is a bug check?
When Windows encounters a condition that compromises safe system operation, the system halts. The system halt is a direct result from a kernel mode component (driver) calling either the KeBugCheck(...) or KeBugCheckEx(...). This condition is called a bug check. It is also commonly referred to as a system crash, a kernel error, a Stop error, a Blue Screen, or a Blue Screen Of Death (BSOD) .
Windows has default settings which control whether the system will automatically restart after a bug check, whether the system will write a mini dump, kernel dump or a full memory dump and wheter it should overwrite the previous dump file. The dumps differ in size and thus they differ in the ammount of information saved at the time of the crash. You can view and change these settings by going to Control Panel -> System Properties -> Advanced tab -> 'Startup and Recovery' Settings. Here is the UI for the System Properties on Windows Vista:


As you can see in the screen shot on the right, on Windows Vista the default is for the system to automatically reboot after a bug check and save a kernel memory dump. On Windows XP the default is for the system to automatically reboot after a bug check and save a mini dump.
The key takeaway is that : a) if your machine restarts when you didn't expect it to, the system bug checked; b) in order to figure out what driver caused the bug check it is best that you have a kernel dump (this is the default on Vista).
How do you diagnose what driver caused the bug check?
The steps are as follows:
- Save the C:\Windows\memory.dmp file somewhere handy (note that the drive letter might be different, depending on which partition you installed Windows on)
- Note that depending on your system settings you might have a 'mini-dump'. To find all the dump files on the system do 'C:\>dir /s *.dmp'
- Download the Windows Debugger. I highly recommend that you spend some time reading through the help file. Specifically, read the 'Debugging Techniques -> Elementary Debugging Techniques' section
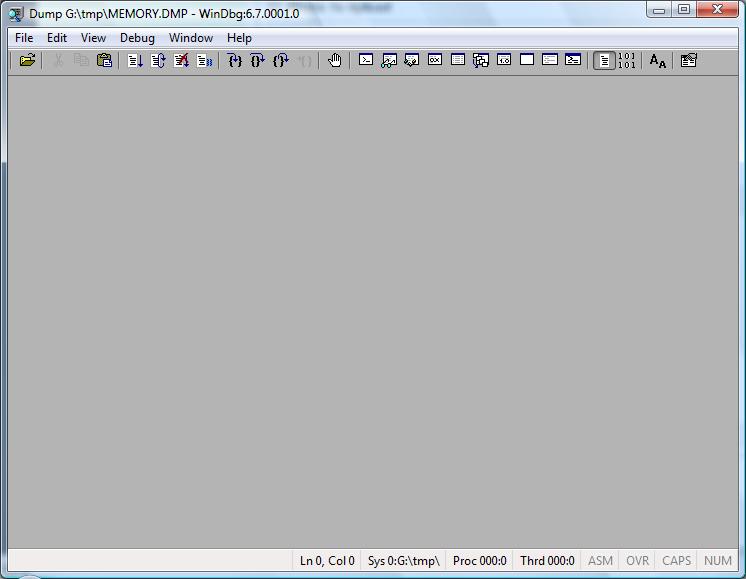
- Start WinDBG (debugger with UI front end) or alternatively you can use the command prompt debugger called 'kd'. 'kd' is located in the directory where you installed the debugger. Here is what you should see...

- Load the memory dump from #1 in the debugger by doing: File -> Open Crash Dump and pointing to the MEMORY.DMP file.
- Load the symbols for the crashing OS by doing: File -> Symbols File Path and point to the directory where you extracted the symbols package. Here is what you should see...
- You can download the symbols package for your OS version from here. Note: Pay attention to the CPU architecture when downloading symbols. The symbols are different for x86, x64 and IA64.
- in the lower right corner is the command line, issue the command !analyze -v and you should see plenty of information about the crash. Here is an example:
0: kd> !analyze -v
*******************************************************************************
* *
* Bugcheck Analysis *
* *
*******************************************************************************
DRIVER_POWER_STATE_FAILURE (9f)
A driver is causing an inconsistent power state.
Arguments:
Arg1: 00000003, A device object has been blocking an Irp for too long a time
Arg2: 8445c700, Physical Device Object of the stack
Arg3: 84fe9428, Functional Device Object of the stack
Arg4: 870ddae0, The blocked IRP
Debugging Details:
------------------
DRVPOWERSTATE_SUBCODE: 3
DEVICE_OBJECT: 84fe9428
DRIVER_OBJECT: 85269e68
IMAGE_NAME: NETw3v32.sys
MODULE_NAME: NETw3v32
FAULTING_MODULE: 8c210000 NETw3v32
DEFAULT_BUCKET_ID: VISTA_BETA2
BUGCHECK_STR: 0x9F
PROCESS_NAME: System
CURRENT_IRQL: 2
LAST_CONTROL_TRANSFER: from 82c1ef3e to 82cd53a9
STACK_TEXT:
80803e1c 82c1ef3e 0000009f 00000003 8445c700 nt!KeBugCheckEx+0x1e
80803e78 82c24841 80803f5c 00000000 82cf8e20 nt!PopCheckIrpWatchdog+0x165
80803eb0 82c7365e 82d0c1c0 00000000 85523e08 nt!PopCheckForIdleness+0x2d5
80803f88 82c724e0 00000000 00000000 00401229 nt!KiTimerExpiration+0x60c
80803ff4 82c61aa9 82a63a48 00905a4d 00000003 nt!KiRetireDpcList+0xca
80803ff8 82a63a48 00905a4d 00000003 00000004 nt!KiDispatchInterrupt+0x3d
WARNING: Frame IP not in any known module. Following frames may be wrong.
80803ffc 00905a4d 00000003 00000004 0000ffff 0x82a63a48
80804000 00000000 00000004 0000ffff 000000b8 0x905a4d
---------
In the example above the driver at fault was NETw2v32.sys. Note that the !analyze command does not always give the correct driver that crashed the system. For example if driver A corrupts driver B's data structure and driver B access that data structure and crashes the !analyze command might blame driver B where in reality driver A was at fault. So whenever memory corruption is involved !analyze cannot be trusted completely.
- Rade Trimceski
Comments
Anonymous
January 23, 2008
PingBack from http://blogs.sepago.de/helge/2008/01/23/windows-x64-all-the-same-yet-very-different-part-2/Anonymous
July 31, 2008
Good information: If I have a dump where there is not much stack trace, IP looks weird, and debug mode was not enabled when the system crashed. All I have is memory dump and image name is ntkrnl... bug check code is D1. How do I go about debugging under such scenarios.