Web Analytics in SharePoint 2010: Insights into Reports and Metrics
Cross-post with the ECM blog
As part of SharePoint 2010, we have created a set of features to help you collect, report, and analyze the usage and effectiveness of your SharePoint 2010 deployment. These set of features are a part of the Web Analytics capabilities of SharePoint 2010. The overview of the Web Analytics features in SharePoint 2010 was presented in this blog post.
This blog post delves deeper into the various metrics available to analyze the site usage data. There are three categories of the SharePoint Web Analytics reports: Traffic, Search, and Inventory. The reports are aggregated for various SharePoint entities like Site, Site Collection, and Web Application for each farm. Further, reports are also aggregated per search service application. By default, the reports show the data for a period of 30 days. One can change the time period to view data for up to 25 months by going to ‘Analyze’ tab.
Visually we show the metrics in one of the two ways: trend reports and rank reports. A trend report shows how a particular metric is doing over a period of time. While a rank report, shows the top 2000 results for a particular metric. Figure 1, 2 show examples of a trend and rank report respectively. That’s not all; you can further analyze the reports by applying filters like string match in the URL, user name, queries, browser and others.
Figure 1: Example of a Trend Report showing Number of Page Views for each day for a default period of 30 days.
Figure 2: Example of a Rank Report showing the Top Pages sorted on the Number of Page Views for a default period of 30 days.
What follows is an overview of each type of the report and the associated metrics. Also, summarized are the kind of reports available for each level of aggregation i.e. Site, Site Collection and Web Application and Search Service Application.
Traffic Reports
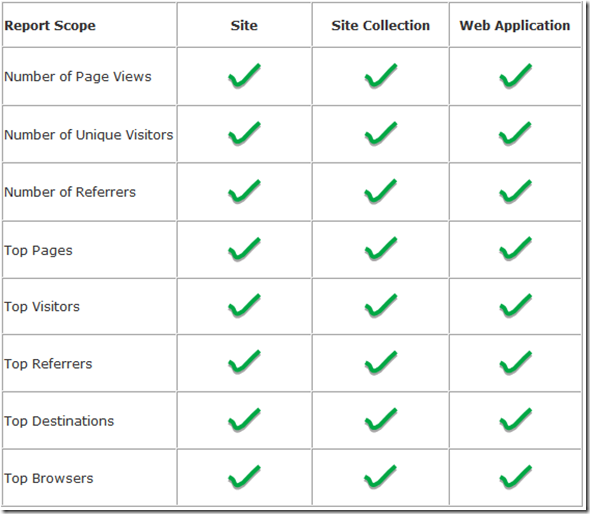
The traffic reports capture the user behavior information related to total clicks, frequent users, popular pages, and information about navigation to and from the current SharePoint component.
Trend Reports
- Number of Page Views: Total number of page views each day.
- Number of Daily Unique Visitors: Total number of unique visitors each day. SharePoint authenticated users and anonymous users (using IP address) are counted as visitors.
- Number of Referrers: Total number of unique URL’s external to the current entity (parent entity is treated as external as well), from where the users navigated to the current entity.
Rank Reports
- Top Pages: Most viewed pages in the current entity.
- Top Visitors: Most frequent visitors of the current entity.
- Top Referrers: Top URL’s external to the current entity from where users navigated to the current entity.
- Top Destinations: Similar to Referrers, these are the top external URL’s that the user visited from the current entity.
- Top Browsers: Top browsers being used to visit the current entity.
Table 1: Summary of the traffic reports availability at different SharePoint hierarchy levels
Note: Traffic Reports do not apply at Search Service Application level.
Search Reports
The search reports capture the user behavior information related to the queries on the site.
Trend Reports
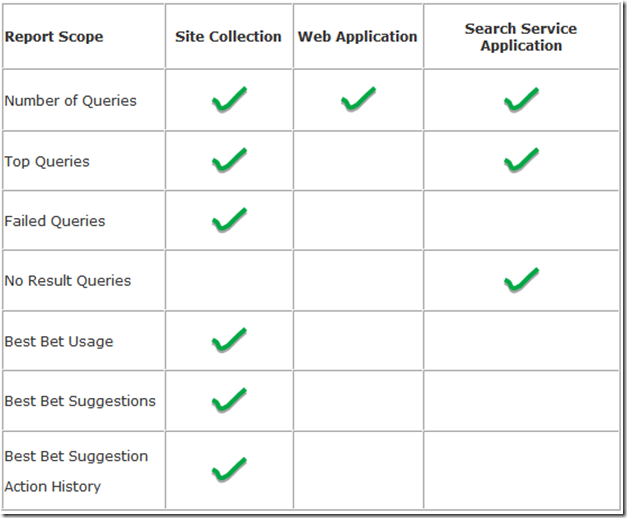
- Number of Queries: Total number of queries each day.
Rank Reports
- Top Queries: Most issued queries per day.
- Failed Queries: Most issued queries for which either there were no results or the user did not click on any results.
- No Result Queries: Most issued queries for which no results were returned.
Other Reports
- Best Bet Suggestion Report: Recommends URLs as most likely results for particular search queries based on analysis of usage patterns. The site administrators can accept or reject these suggestions. If they accept, the corresponding query-URL pair is added to the search keywords list.
- Best Bet Usage: Shows how Best Bet suggestions are doing over time. For every Best Bet query issued, the report shows the percentage of clicks on the Best Bet URL compared to other URLs.
- Best Bet Action History Report: Tracks the actions performed by the site administrator on the ‘Best Bet Suggestion’ Report.
Table 2: Summary of the search reports availability at different SharePoint component hierarchy levels
Note: The search reports do not apply at Site Level.
Inventory Reports
The inventory reports are targeted to help the site administrators in managing the site by keeping track of the site structure and storage and version issues.
Trend Reports
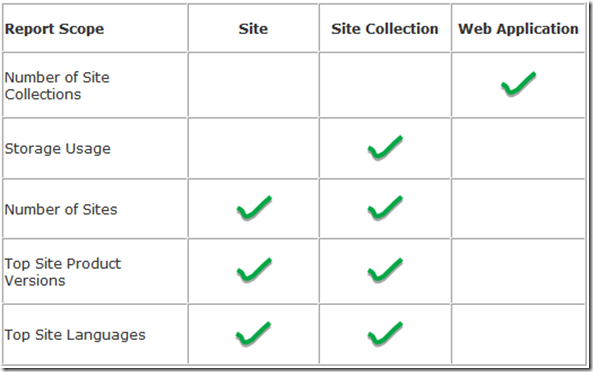
- Number of Site Collections: Total number of site collections for each Web Service Application for each day.
- Storage Usage: Total storage used in Megabyte (MB) for a site collection and the ‘Maximum Storage Allowed’ in MB for each day.
- Number of Sites: Total number of sites within each Site Collection for each day.
Rank Reports
- Top Site Product Versions: The ‘Site Product Version’ sorted in the order of ‘Number of Sites’ or ‘Percentage of Overall’ sites using the corresponding version for this site collection.
- Top Site Languages: The ‘Site Product Language’ sorted in the order of ‘Number of Sites’ or ‘Percentage of Overall’ sites using that language for this site collection.
Table 3: Summary of Inventory Reports availability at different SharePoint component hierarchy levels
Note: Traffic Reports do not apply at Search Service Application level.
Look out for more to come
Keep an eye out for more blogs on customizing the reports using Excel, using workflow feature to scheduled reports and alerts and adding the ‘What’s Popular’ Web Part to your pages
Comments
Anonymous
January 01, 2003
good postAnonymous
November 15, 2010
What is the difference in Site Web Analytics Reports and Site Collection Web Analytics Reports? I thought one was for the Whole Site Collection and the other for just the site and not sub-sites but that does not appear to be the case.Anonymous
October 12, 2015
Hi,
is there any default limit for unique visitor? my analytics seems cannot have number more than 2000 unique viewers. its weird since we have around 6000 uniques users.
Thank you.


