MPI Cluster Debugger in Visual Studio2010 Beta1
If you ever write MPI program in Windows HPC cluster, you should be familiar with MPI Cluster Debugger in Visual Studio2005/2008. Also, you can find much resource online talking about it (such as blog, white paper). Do you like to debug MPI program in cluster? Is the debugger easy to use? Visual Studio 2010 Beta1 is already released now. HPC team investigates much effort to improve the MPI Cluster Debugger. Let’s go through it.
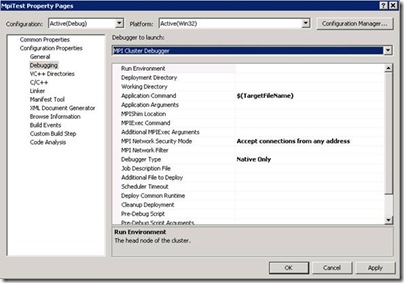
At the same place (Project Property Page), we find the MPI Cluster Debugger. The difference is that much more properties are there now. Don’t worry, although there are about 20 properties. You will be familiar with them soon. In most cases, we only need to concern 3 properties. Default values will be used for other properties, if leave them empty.
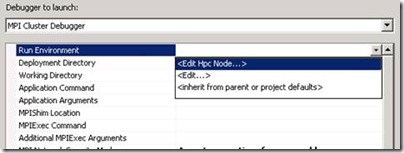
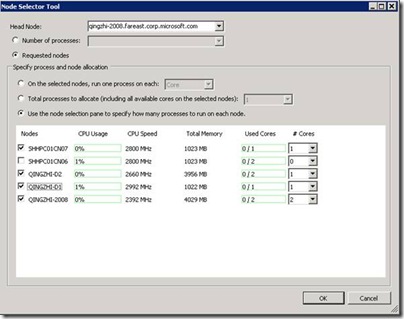
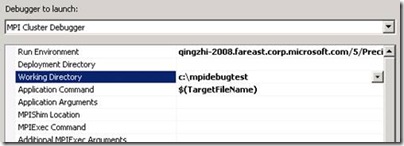
The most important thing is to specify the Headnode, when we want to debug program in a cluster. “Run Environment” is the first mandatory property. Click “Edit Hpc Node…”, the “Node Selector” dialog pops up. We can specify the Headnode and choose computer nodes here. Either specify the total number of the MPI processes, either precisely specify the number of MPI processes on the selected nodes. In this page, we also can get the real time CPU usage of each node in the cluster. If we only need to debug the program on local machine by 4 processes, just input “localhost/4”.
Another mandatory property is “Working Directory”. It must be a local path. MPI Cluster Debugger will help us to create it if it doesn’t exist. The last mandatory property is “Application Command”. We can use the VS build-in macro there, such as $(TargetFileName)”.
“Deployment Directory” is optional, its default value is \\<HeadNode>\CcpSpoolDir\<UserName>. CcpSpoolDir is created during the installation of the Windows HPC Cluster. If we don’t like to use the default value, input ours. Make sure it is a shared path, and we have permission to read and write file there.
We can select different debugger engine through “Debugger Type” property. If we want to debug MPI .Net program, “Managed Only” is the choice.
Each property has an explanation at the bottom of that page, so I don’t go through them one by one. Let me know if you don’t quite get it.
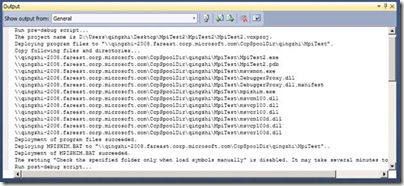
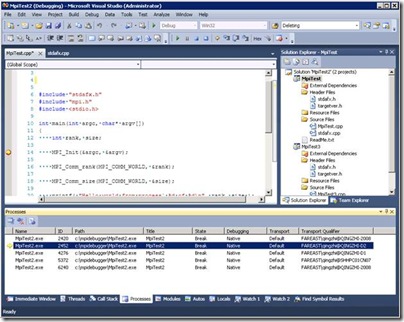
When the mandatory properties are specified, we can use the basic feature of the MPI Cluster Debugger now. Press “F5”. After a while, the MPI processes are launch on the selected nodes, and attached by the vs. In the “Output View” of vs, we can get to know what happened. If error occurs, detail information will be printed here. In”Processes View”, we can find the MPI processes. The break point in the source file will be hit when process passes by there.
We briefly go through the MPI Cluster Debugger above. Some small changes may happen in Beat2 or the RTM version. If you have any feedback or suggestions, reply to me. Thank you!
