Cenário de exemplo de Scripts do Office: buscar e grafar dados em nível de água da NOAA
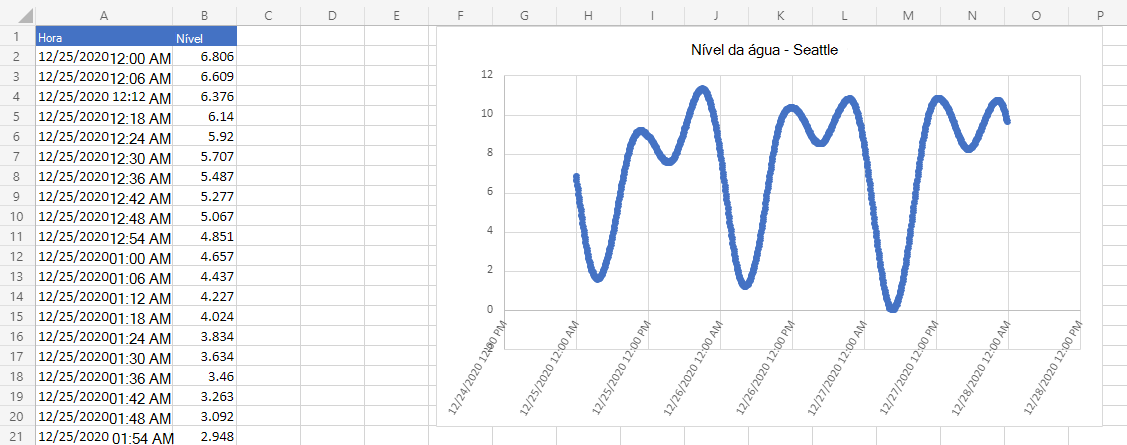
Neste cenário, você precisa plotar o nível da água na estação de Seattle da Administração Nacional Oceânica e Atmosférica. Você usará dados externos para preencher uma planilha e criar um gráfico.
Você desenvolverá um script que usa o fetch comando para consultar o banco de dados NOAA Tides and Currents. Isso fará com que o nível da água seja registrado em um determinado período de tempo. As informações serão retornadas como JSON, portanto, parte do script traduzirá isso em valores de intervalo. Depois que os dados estiverem na planilha, eles serão usados para fazer um gráfico.
Para obter mais informações sobre como trabalhar com JSON, leia Usar JSON para passar dados de e para scripts do Office.
Habilidades de script abordadas
- Chamadas de API externa (
fetch) - Análise JSON
- Gráficos
Instruções de instalação
Abra a pasta de trabalho no Excel.
Na guia Automatizar, selecioneNovo Script e cole o script a seguir no editor.
/**
 * Gets data from the National Oceanic and Atmospheric Administration's Tides and Currents database.
 * That data is used to make a chart.
 */
async function main(workbook: ExcelScript.Workbook) {
  // Get the current sheet.
  let currentSheet = workbook.getActiveWorksheet();

  // Create selection of parameters for the fetch URL.
  // More information on the NOAA APIs is found here:
  // https://api.tidesandcurrents.noaa.gov/api/prod/
  const option = "water_level";
  const startDate = "20201225"; /* yyyymmdd date format */
  const endDate = "20201227";
  const station = "9447130"; /* Seattle */

  // Construct the URL for the fetch call.
  const strQuery = `https://api.tidesandcurrents.noaa.gov/api/prod/datagetter?product=${option}&begin_date=${startDate}&end_date=${endDate}&datum=MLLW&station=${station}&units=english&time_zone=gmt&application=NOS.COOPS.TAC.WL&format=json`;

  console.log(strQuery);

  // Resolve the Promises returned by the fetch operation.
  const response = await fetch(strQuery);
  const rawJson: string = await response.json();

  // Translate the raw JSON into a usable state.
  const stringifiedJson = JSON.stringify(rawJson);

  // Note that we're only taking the data part of the JSON and excluding the metadata.
  const noaaData: NOAAData[] = JSON.parse(stringifiedJson).data;

  // Create table headers and format them to stand out.
  let headers = [["Time", "Level"]];
  let headerRange = currentSheet.getRange("A1:B1");
  headerRange.setValues(headers);
  headerRange.getFormat().getFill().setColor("#4472C4");
  headerRange.getFormat().getFont().setColor("white");

  // Insert all the data in rows from JSON.
  let noaaDataCount = noaaData.length;
  let dataToEnter = [[], []]
  for (let i = 0; i < noaaDataCount; i++) {
    let currentDataPiece = noaaData[i];
    dataToEnter[i] = [currentDataPiece.t, currentDataPiece.v];
  }

  let dataRange = currentSheet.getRange("A2:B" + String(noaaDataCount + 1)); /* +1 to account for the title row */
  dataRange.setValues(dataToEnter);

  // Format the "Time" column for timestamps.
  dataRange.getColumn(0).setNumberFormatLocal("[$-en-US]mm/dd/yyyy hh:mm AM/PM;@");

  // Create and format a chart with the level data.
  let chart = currentSheet.addChart(ExcelScript.ChartType.xyscatterSmooth, dataRange);
  chart.getTitle().setText("Water Level - Seattle");
  chart.setTop(0);
  chart.setLeft(300);
  chart.setWidth(500);
  chart.setHeight(300);
  chart.getAxes().getValueAxis().setShowDisplayUnitLabel(false);
  chart.getAxes().getCategoryAxis().setTextOrientation(60);
  chart.getLegend().setVisible(false);

  // Add a comment with the data attribution.
  currentSheet.addComment(
    "A1",
    `This data was taken from the National Oceanic and Atmospheric Administration's Tides and Currents database on ${new Date(Date.now())}.`
  );

  /**
   * An interface to wrap the parts of the JSON we need.
   * These properties must match the names used in the JSON.
   */
  interface NOAAData {
    t: string; // Time
    v: number; // Level
  }
}
Renomeie o script como Gráfico de Nível de Água da NOAA e salve-o.
Executando o script
Em qualquer planilha, execute o script do Gráfico de Nível de Água da NOAA . O script busca os dados de nível da água de 25 de dezembro de 2020 a 27 de dezembro de 2020. As const variáveis no início do script podem ser alteradas para usar datas diferentes ou obter informações diferentes da estação. A API do CO-OPS para Recuperação de Dados descreve como obter todos esses dados.
Depois de executar o script
