Query progress: anytime, anywhere
Cross post with https://aka.ms/sqlserverteam
One of the most important actions when a performance issue hits, is to get precise understanding on the workload that’s executing and how resource usage is being driven. The actual execution plan is an invaluable tool for this purpose.
Query completion is a prerequisite for the availability of an actual query plan, but with LQS (Live Query Statistics), you can already get information about in-flight query executions (see this blog post), which is especially useful for long running queries, and queries that run indefinitely and never finish.
To look at in-flight query executions, the query execution statistics profile infrastructure must be enabled on demand.
The query execution statistics profile infrastructure can be enabled for a target session:
- Clicking on Include Live Query Statistics in SSMS.
- SET STATISTICS XML ON
- SET STATISTICS PROFILE ON
Or globally, to view LQS for all sessions (such as from Activity Monitor), by enabling the query_post_execution_showplan.
But enabling this event can take a big performance toll in your production server, and so probably you are not running with it continuously, even if it gives you the ability to tap into any running executions, and query plans with execution statistics.
With SQL Server 2016 and SQL Server 2014 SP2, we managed to considerably bring down the performance toll of running this xEvent (see table below, middle row), and also introduced the query_thread_profile extended event. This also enables LQS for all sessions.
Now with SQL Server 2016 SP1, we are introducing a real lightweight query execution statistics profiling infrastructure, to dramatically reduce performance overhead of collecting per-operator query execution statistics, such as actual number of rows. This feature can be enabled either using global startup trace flag 7412, or is automatically turned on when query_thread_profile xEvent is enabled.
How much lightweight you ask?
We ran a TPC-C like workload in both the legacy and lightweight profiling infrastructures, and this is what we found:
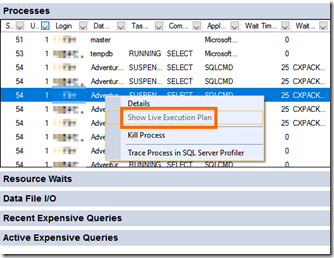
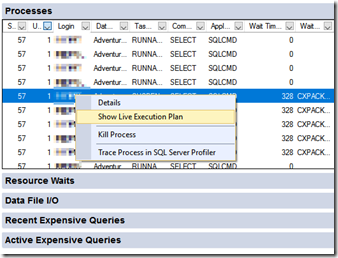
So you can see above that enabling the new lightweight profiling infrastructure (with the trace flag 7412) has a max overhead of 2 percent, as opposed to 75 percent before SQL Server 2014 SP2/2016 RTM. This means that now, for any server that is not already resource bound, you can run the lightweight profiling infrastructure continuously, and tap into any running execution at any time using for example Activity Monitor or directly querying sys.dm_exec_query_profiles, and get the query plan with execution statistics.
The possibilities this unlocks for performance troubleshooting in production environments are tremendous, and if your servers are not already resource bound, we encourage you to enable this trace flag for the potential it unlocks. As usual, we recommend you test this in a pre-production environment to estimate your specific impact beforehand.
When the lightweight profiling is enabled, the information in sys.dm_exec_query_profiles (and so LQS) is available via the new profiling infrastructure instead of the legacy profiling infrastructure.
There’s also the new DMF sys.dm_exec_query_statistics_xml, which returns the query execution plan for in-flight requests. For example, you can now use this DMF to get the plan for a query while it is running, and works under both legacy and lightweight profiling infrastructure.
Use this DMV to retrieve the showplan XML with transient statistics, as seen below:
And you can join with other DMVs like sys.dm_exec_requests. The Running-Blocked-Processes script in the TigerToolbox Github is already using this to access the “live_query_plan_snapshot”.
Pedro Lopes (@sqlpto) – Senior Program Manager


