SQL Swiss Army Knife #14 - Troubleshooting with Waits and Latches
EDIT (4/12/2017): Detailed categorization of waits; added new waits; moved scripts to Github.
Hello,
The topic of Waits and Latches is quite well documented around the web, and there are several nice references that I list further down. Suffice to say that SQL Server waits, specifically threads that are executed have to wait for resource availability to carry on its work, either internal or external resources. These resources may be locks, cpu quantum time, latches, sleeps, and a variety of other examples. Some are indicative of issues, some can be safely ignored.
So the ability to quickly find these waits, namely the ones that are symptoms of bottlenecks, makes all the difference in understanding how your SQL Server instances are being used, and where you have margin to improve.
And what is this post about? This is about sharing a couple more scripts in the SQL Swiss Army Knife series, this time to quickly identify where your system is hurting, categorizing the most common wait types and latch classes.
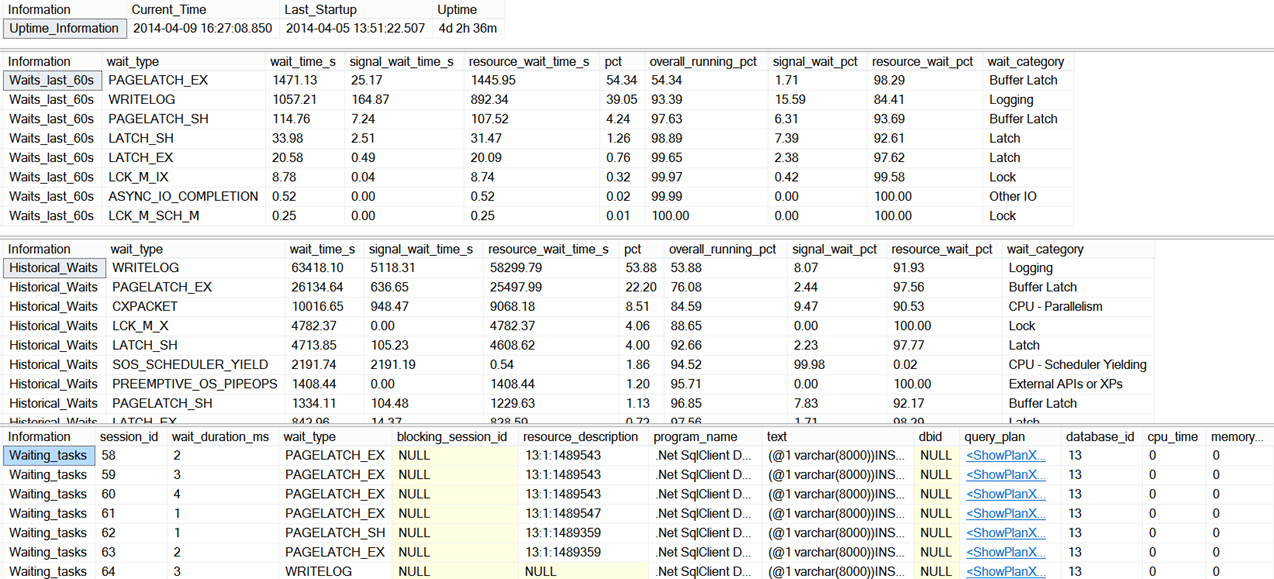
Let’s see an example of the kind of output we get, first for view_Waits.sql:
- We can quickly see in the image below that historically (either since the instance came online or someone last cleared the DMVs using DBCC SQLPERF), most waits (54 percent) in this instance have been related to WRITELOG. This is related to logging (obvious in this case), and this means the log management system is waiting for a log flush to occur. Next step would be to examine the IO latency for the log file, and carry on from there.
- We can also see about 22 percent PAGELATCH_EX waits, which might be related to contention while doing UPDATE statements against small tables, or even UPSERTS against a table that has a conceptually good clustering key (see more in PAGELATCH_EX waits and heavy inserts post).
- And also CXPacket waits amount to 8.5 percent - so not my main concern at the moment.
However, over the last 60 seconds (this is configurable), we see a slightly different scenario:
- Most waits relate to PAGELATCH_EX (54 percent) and PAGELATCH_SH (4 percent), and we can see further down in the “Waiting_tasks” section what are the statements in execution that are matching waiting tasks, so we have a starting point for our troubleshooting – now we have to look on how to mitigate the issue, minding what resources are affected in this case. We could also use another SQL Swiss Army Knife script for the purpose of identifying these statements. The solution for this particular case can be seen in my PAGELATCH_EX waits and heavy inserts post.
- WRITELOG comes next, and again we can look further down in the “Waiting_tasks” section that it’s the same statement, so the workload is really pounding my poor SSD (all the wrong configs regarding NTFS cluster size or file placement are present in my laptop).
Now looking at the output for view_Latches.sql, nothing we wouldn’t expect about the main “culprit” – BUF latches make up 82 percent of total latch waits. However the output of this script is very useful in other cases.
Take a scenario where in an OLTP system, we might see top waits pointing to LATCH_XX, and CXPackets might also be somewhat high (although even below 20 percent). Next we need to know what are the predominant latch classes, and this script shows us the main latch class is ACCESS_METHODS_DATASET_PARENT. Although CXPacket waits are perhaps not our main concern, knowing our main latch class is used to synchronize child dataset access to the parent dataset during parallel operations, we can see we are facing a parallelism issue – and we can follow up from there, having just narrowed the problem using waits and latches output.
And finally, here are a few good references for further reading on troubleshooting using Waits and Latches, most importantly the meaning of the various Latches and Waits. Note that the Books Online articles are very well documented nowadays, and there has been a significant effort in this regard:
SQL Server Books Online: sys.dm_os_wait_stats (Transact-SQL) SQL Server Books Online: sys.dm_os_latch_stats (Transact-SQL) SQL Server Books Online: sys.dm_os_waiting_tasks (Transact-SQL) CSS blog: The SQL Server Wait Type Repository... CSS Blog: How it works: CMEMTHREAD and debugging them Service Broker PG Team blog: Service Broker Wait Types
Glenn Alan Berry chapter in the MVP Deep Dive Book
Paul's blog: Wait statistics, or please tell me where it hurts Paul's blog: Advanced SQL Server performance tuning Paul's blog: Most common latch classes and what they mean
That’s it for now, hope you find these useful.
Download scripts here: view_Waits.sql and view_Latches.sql
Until next time!
Disclaimer: I hope that the information on these pages is valuable to you. Your use of the information contained in these pages, however, is at your sole risk. All information on these pages is provided "as -is", without any warranty, whether express or implied, of its accuracy, completeness, fitness for a particular purpose, title or non-infringement, and none of the third-party products or information mentioned in the work are authored, recommended, supported or guaranteed by Ezequiel. Further, Ezequiel shall not be liable for any damages you may sustain by using this information, whether direct, indirect, special, incidental or consequential, even if it has been advised of the possibility of such damages.

