NativeCountersCollection.ps1 – The story of the long running script
Hi SCOM guys and IT Guys,
I want to share something interesting about the Performance Collection done by the Microsoft Exchange Server 2013 Management Pack.
On one of my customers, we had lots of "Operations Manager failed to start a process" alerts randomly coming from different Exchange Servers. This is a generic alert, indicating that a given script was killed by SCOM itself because it runs over the allowed configured timeout. Even if it is not an issue as per se, a high recurrence of this alert or a high Repeat Count value must not be underestimated since it denotes that the monitoring is not carried on as it should.
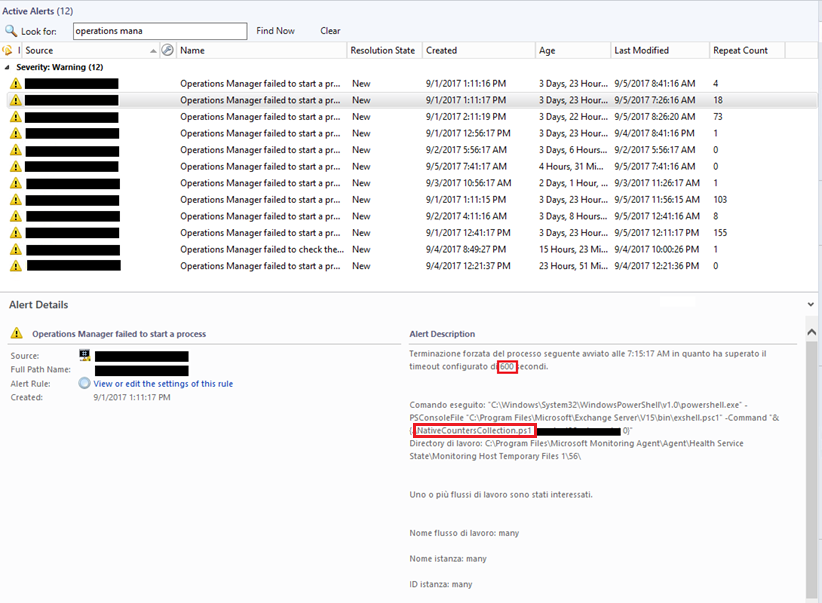
As you can see from the screenshot, the failing script was the "NativeCountersCollection.ps1" (which is used by nearly 46 different rules that collects performance data for reporting purpose) that went over the 600 seconds.

For those of you which are not familiar with the Exchange Management Pack, and in particular with this script, it retrieves the configured Exchange counters (for all roles and all instances based on the installed culture) and perform a point-in-time collection using the Get-Counter PowerShell cmdlet. It is normally configured to run every 900 seconds and with a timeout value of 300 seconds.
Since my customer' environment is a medium one with roughly 30 servers and more than 200 mailbox databases, it could have been reasonable to have the script running for more than 300 seconds. As you can imagine there are several instances for each counter, in function of the environment size. So, I started the troubleshooting by increasing the timeout value to 400, then 500 and then 600. At that point, even considering the environment size, I thought that it was not acceptable, in this environment, to have a script that collects point-in-time performance counter values, running for more than 10 minutes.
I went ahead with the troubleshooting by running the script manually (and outside of SCOM) on the impacted servers, taking note of the starting and finishing time. No doubt; the script took around 10 minutes and sometimes even more. Together with the customer, with the assumption that it was not a capacity problem or Exchange related problem since there were neither clear symptoms of CPU, Memory or Disk sufferings nor evident leaks, we decided to investigate the server configuration. We did some basic checks and, surprisingly, we found out that the Power Plan was configured to "Balanced (recommended) "

To prove that this setting could have been the root cause, we changed it to "High Performance" on one server, tested the script once again and  . The script execution time went down from the previous 9-10 minutes to roughly 3-4. Yes, you got it right: 60-70% faster. We repeated the test on 3 other servers and same result, so the decision was made: we must change the Power Option setting to use the "High Performance" power plan.
Setting the power plan to High Performance is not negatively impacting the overall system performance, so you can set it on every server. More information about performance issue related to the "Balanced (recommended) " power plan can be found in the article Slow Performance on Windows Server when using the "Balanced" Power Plan at https://support.microsoft.com/en-us/help/2207548/slow-performance-on-windows-server-when-using-the-balanced-power-plan
How can you do it? Well, there are different options:
- Manually on selected servers only
- Using a PowerShell script (find a sample for Exchange servers attached below) on selected servers
- On all server using a Group Policy
I leave the decision on how to change this setting up to you. Nobody knows your infrastructure better than you
Hope that helps.
Thanks!