Why is my Azure App Service down?
Why is my Azure App Service Slow? Why does my Azure App Service consume so much CPU? Why does my Azure App Service consume so much memory? Why does my Azure App Service restart? Why does my Azure App Service open so many TCP connections?
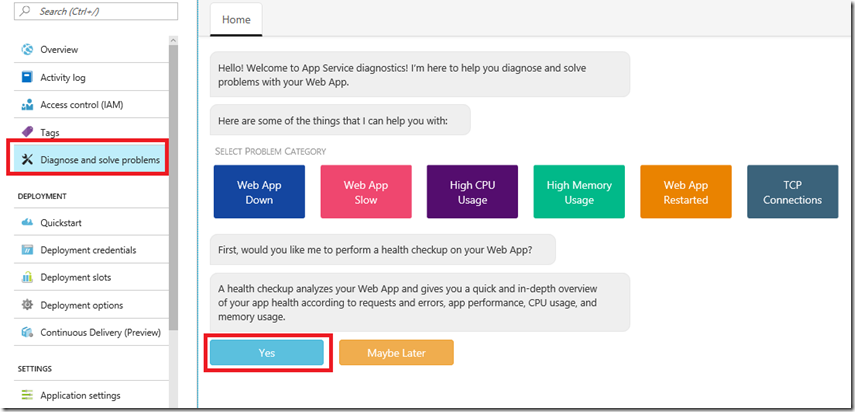
If you have ever asked any of those questions, look no further. As seen in Figure 1, you can now check for the answer to those questions within the Azure management portal. These are App Service Diagnostics! Check out this video and this blog.
Figure 1, troubleshoot, fix my Azure App Service
Click on the PROBLEM CATAGORY for which you would like to analyze and the tool will run a report and provide some reasons and solutions.
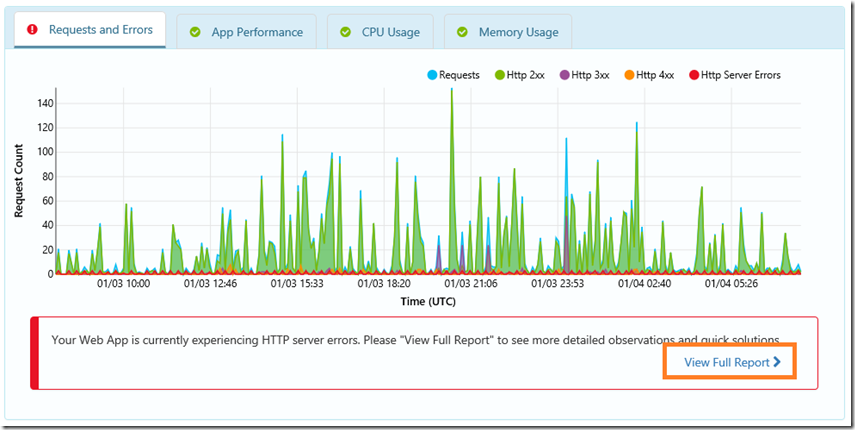
I looked at one of my sites I run as an Azure App Service and clicked the YES button to see how things were going and I got the cool report as seen in Figure 2.
Figure 2, how to automate the troubleshoot, fix my Azure App Service
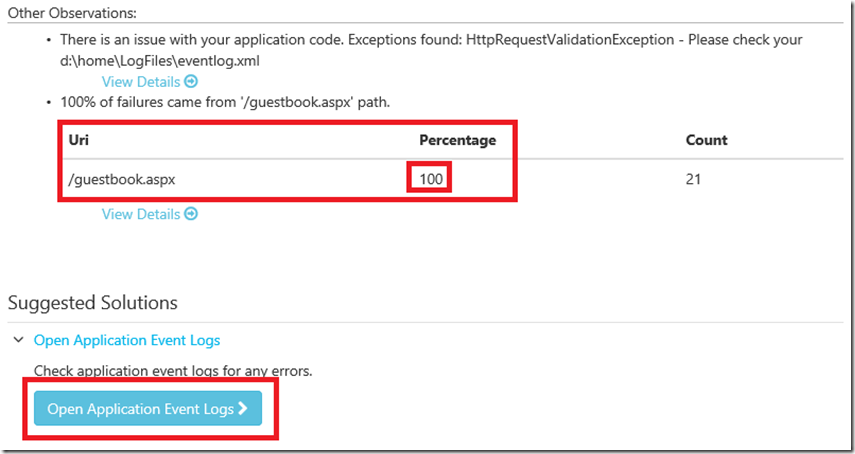
Little did I know that there was some issue with some code I wrote years ago and this tool was able to surface that. I clicked on the View Full Report link and the output explained where the exception was and how often, Figure 3. I drilled down and found the problem.
Figure 3, how to automate the troubleshoot, fix my Azure App Service
I looked at the Application Exception and found “HttpRequestValidationException - A potentially dangerous Request.Form value was detected from the client” which means someone was trying to inject HTML or a script reference into the form. I implemented one of the proposed protection features described here “How To: Protect From Injection Attacks in ASP.NET”.


