Crack Throttling: Debugging WCF TimeoutException for a Middle-Tier Application
Recently I helped a customer with a few friends to debug a TimeoutException issue happened in their middle-tier which uses WCF proxies. The issue turned out to be simple but the experience was quite interesting and I would like to tell you how we proceeded with it.
Problem
The customer’s scenario is a multi-tier application as following:
ASPX clients [AC] ó ASPX invokes WCF clients [FE] ó WCF service (Basic Http with Binary) [BE] ó Backend services (over NamedPipe/HTTP) [BS]
The “ASPX clients” ([AC]) are web clients for a load testing. They send about 60 – 100 concurrent requests to the frontend ASP.NET web pages ([FE]) which are hosted on a front-end server machine. The web pages use WCF proxies to invoke the backend WCF service ([BE]) which is hosted on a back-end server machine. And then the WCF service invokes other backend services ([BS]). All is based on request/reply message exchange pattern.
After a while, the front-end ([FE]) starts to get TimeoutException for some requests as showing in the WCF trace log:
<ExceptionType>System.TimeoutException, mscorlib, Version=2.0.0.0, Culture=neutral, PublicKeyToken=b77a5c561934e089</ExceptionType>
<Message>The HTTP request to 'https://co1wacwb201/Conversion.svc' has exceeded the allotted timeout of 00:00:20. The time allotted to this operation may have been a portion of a longer timeout.</Message>
<StackTrace>
at System.ServiceModel.AsyncResult.End[TAsyncResult](IAsyncResult result)
at System.ServiceModel.Channels.HttpChannelFactory.HttpRequestChannel.HttpChannelAsyncRequest.End()
at System.ServiceModel.Channels.RequestChannel.EndRequest(IAsyncResult result)
at System.ServiceModel.Dispatcher.RequestChannelBinder.EndRequest(IAsyncResult result)
at System.ServiceModel.Channels.ServiceChannel.SendAsyncResult.FinishSend(IAsyncResult result, Boolean completedSynchronously)
The SendTimeout of the binding was set to be 20 seconds. However, based on the statistics, the backend service ([BS]) should not take 20 seconds. The number of concurrent requests is not very high. So why did this happen?
Debugging
ASP.NET/WCF Settings
By working with the customer, we first checked the different throttling settings for both ASP.NET and WCF to see whether everything is running as expected. The following is the checklist that we have used.
1) WCF Service Throttling
The first step is to make sure that the backend has big enough WCF service throttling settings. It turns out that the backend has used quite large settings:
· MaxConcurrentCalls: it’s set to 100.
· MaxConcurrentSessions: it’s set to 100.
· MaxConcurrentInstances: it’s set to 200.
These settings should be big enough for the scenario given that number of concurrent clients. Actually the binding is BasicHttpBinding. So MaxConcurrentSessions should not matter at all here.
2) InstanceContextMode/ConcurrencyMode
As per my early blog, the default InstanceContextMode is PerSession and the default for ConcurrencyMode is Single. However, PerSession is equivalent to PerCall for BasicHttpBinding. So there should be no contention here if everything is used as default. After checking the code snippet, it turns out that the settings are not default:
[ServiceBehavior(InstanceContextMode = InstanceContextMode.Single,
ConcurrencyMode = ConcurrencyMode.Multiple)]
public sealed class MyService
This usage allows concurrent requests for the same service operation and it is also fine.
3) ASP.NET Threading Settings
Now the next thing that I thought was to check the ASP.NET threading settings as per the whitepaper. The server machine is dual-proc/4-core and thus 8-way box. So the following default should be enough:
<system.web>
<processModel maxWorkerThreads="100" maxIoThreads="100" minWorkerThreads="2"/>
<httpRuntime minFreeThreads="704" minLocalRequestFreeThreads="608"/>
</system.web>
In this case, ASP.NET would be able to execute 12 * 8 = 96 concurrent requests. They should be also big enough.
4) MaxConcurrentRequestsPerCPU
As per Thomas Marquardt, this setting has a default value of 12 and it’s available through the following registry:
HKEY_LOCAL_MACHINE\SOFTWARE\Microsoft\ASP.NET\2.0.50727.0
“MaxConcurrentRequestsPerCPU”=dword:0000000C
By default, this registry does not exist, but the value is 12. It’s also settable from the ASP.NET application pools setting file %windir%\Microsoft.NET\{Framework|Framework64}\v2.0.50727\Aspnet.config:
<system.web>
<applicationPool maxConcurrentRequestsPerCPU="12" maxConcurrentThreadsPerCPU="0" requestQueueLimit="5000"/>
</system.web>
This setting again is good enough for the scenario as the throttling setting is actually 96.
5) Client Settings
To this point, it does not look like any other server settings would matter here. So we need to check whether all client requests were pushed to the backend WCF service. So we asked the customer to try to increase the “maxconnection” setting as per my previous blog entry:
<system.net>
<connectionManagement>
<add address="*" maxconnection="96"/>
</connectionManagement>
</system.net>
The customer did that but the problem did not go away after this setting.
To this point, I have run out of the throttling settings that I can think of. So the next step is to gather more data for the system.
Trace Log
We asked the customer to enable Warning and Error level WCF tracing to see whether the WCF service has generated any exception and silently fails the client, though it is quite unlikely to happen in usual case. As expected, the log did not show anything interesting. Only the front-end log showed the TimeoutException and the callstack that I pasted above. So the log did not help here.
WinDBG Dump
Process dump can usually tell us a lot of information of the server process. We can examine the managed objects, states, threads, and call stacks. The caveat is that a dump only reflects a single data point of the process and it does not have overall progress. So we ask the customer to generate the process dump with WinDBG.
We examined the objects in the heap and searched for the corresponding WCF objects such as ThreadPool, FlowThrottle, InputQueue, etc by using the SOS debugging extension. We did not find anything wrong with those. We noticed that there were 9 I/O threads:
00000000`0961f160 000007fe`f8aaf0ac mscorwks!ThreadpoolMgr::CompletionPortThreadStart(void * lpArgs = 0x00000000`00000000)+0xee
00000000`0961f200 00000000`7737466d mscorwks!Thread::intermediateThreadProc(void * arg = 0x00000000`00000000)+0x78
There are totally 48 CLR worker threads:
00000000`0497fd70 00000000`7737466d mscorwks!Thread::intermediateThreadProc(void * arg = 0x00000000`00000000)+0x78
And there are about 41 other threads. With this data, we could not figure out the root cause of the timeout issue yet, especially when the process dump is only at a single time stamp. So at this moment, we moved on to look for other data first.
NetMon Capture
In many cases, Network Monitor capture data can provide very detailed information and can be very useful for analyzing network performance and reliability issues. We can analyze the TCP packages and frames and examine the conversations to find out how the data were transferred between the client and the server. The tricky part is that it took about an hour to reproduce the problem and the captured data size was pretty big (around 500MB). Searching for correlated requests between the client and the service was quite a challenge. This is another hard route as using WinDBG to debug the problem. So we skipped this step for this investigation for now.
Client Latency Distribution
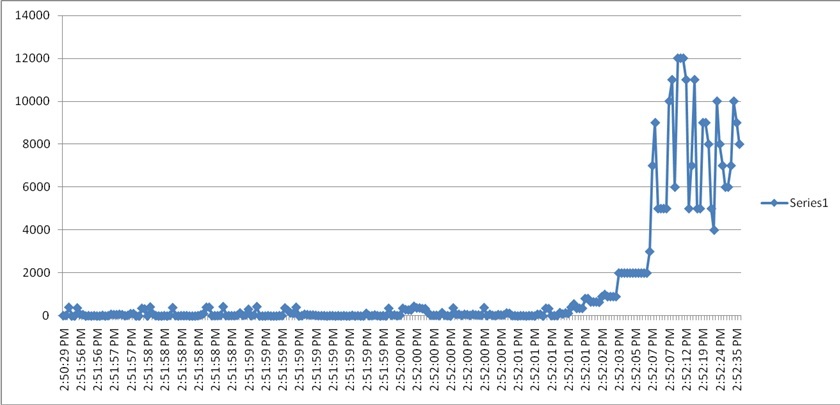
We further gathered the distribution data for the client latency as the following graph. It shows that that system worked just fine in the first 92 seconds. All requests completed in sub-seconds. Then it started to show erratic behavior with longer latencies from 4 up to 12 seconds in the subsequent half minute. We need to understand better why this started to happen. So next we really needed to check the distribution for other data types on the front-end and the back-end machines.

Performance Counter Data
A more useful view of the system is to use the data for the ASP.NET and WCF performance counters. Performance counters are very light-weighted and it’s easily to gather the data without affecting the product performance much.
ASP.NET performance counters are turned on by default. We just need to enable WCF performance counters. In order to enable WCF ServiceOnly performance counters, you can add the following to the application configuration file (such as web.config in this case):
<system.serviceModel>
<diagnostics performanceCounters="ServiceOnly" />
</system.serviceModel>
The following is a list of interesting performance counters that we used to investigate the issue:
Perf Counter Category |
Perf Counter Name |
ASP.NET |
Request Execution Time |
ASP.NET |
Requests Queued |
ASP.NET |
Request Wait Time |
ASP.NET Applications |
Requests Executing |
ASP.NET Applications |
Pipeline Instance Count |
ServiceModelService 3.0.0.0 |
Call Duration |
ServiceModelService 3.0.0.0 |
Calls Outstanding |
To find out more details, you can check the following two articles:
1) ASP.NET Performance Monitoring guide: https://msdn.microsoft.com/en-us/library/ms972959.aspx
2) WCF Performance Counters: https://msdn.microsoft.com/en-us/library/ms735098.aspx
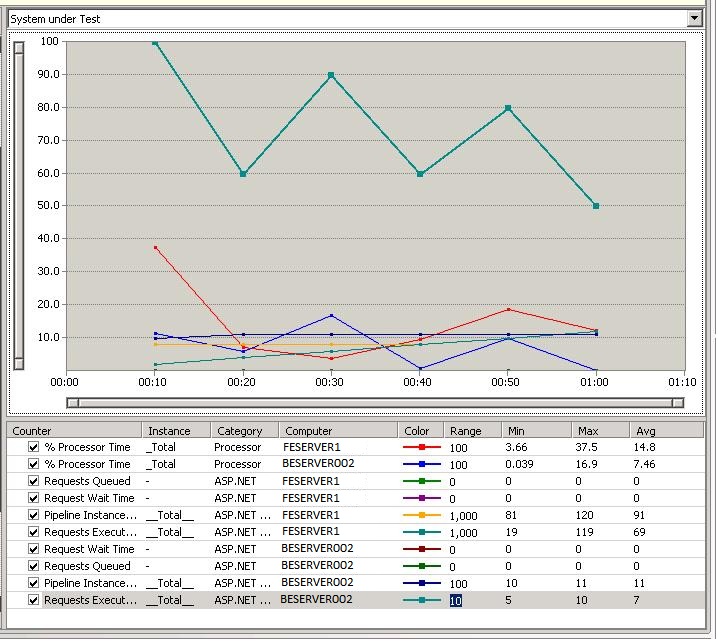
Here is the data that we got from the customer:

This graph gives us very interesting data:
1) The CPU usage on both the front-end server FESERVER1 and the back-end server BESERVER002 is low. So there shouldn’t be traffic congestion/starvation problem.
2) There are no queued requests in the ASP.NET queues because “Requests Queued” counters are 0 on both machines.
3) Both the “Pipeline Instance Count” and the “Requests Executing” counters are pretty high on the front-end server FESERVER1. They are 91 and 69 in average respectively and they matched the number of concurrent clients.
4) However, the above counters are very low on the back-end server BESERVER002. They are 11 and 7 in average respectively. This is a very interesting data point.
From the above data, basically all of the requests are accumulated in the front-end server and they cannot be pushed all the way to the backend. The requests did not reach to the ASP.NET layer on the backend server. Something must be set incorrectly. What could have blocked the requests from being pushed to the backend server?
We checked the code usage of WCF client proxies in the front-end. The code did not use cached proxies. In this case, there should be no contention in the code. We have to check the configuration again.
Configuration Rechecking
Based on the analysis, we believed that that requests were blocked by the throttling in the front-end. We still have the doubt of the System.Net’s “maxconnection” setting.
My friend Mauro Ottaviani spotted an incorrect setting in the machine.config:
<section name="connectionManagement" type="System.Net.Configuration.ConnectionManagementSection, System, Version=2.0.0.0, Culture=neutral, PublicKeyToken=b77a5c561934e089">
<add address="*" maxconnection="96"/>
</section>
The highlighted line was incorrect placed in the section handler definition part of machine.config instead of under the <system.net> node. The system simply ignored the above <add> element and thus used the default values.
Resolution
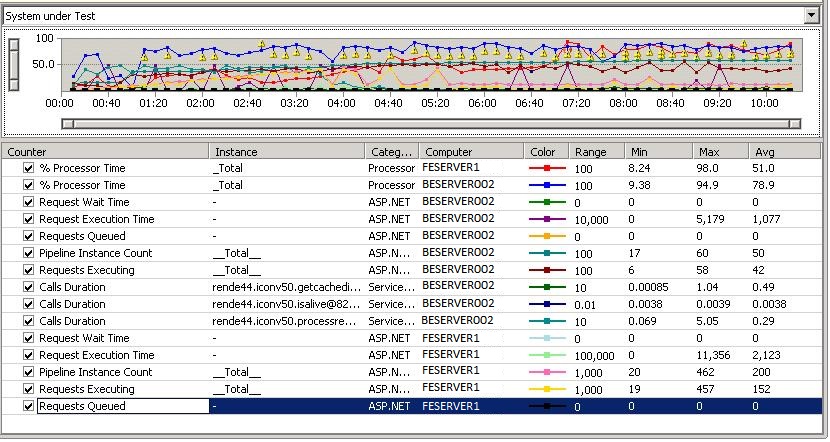
After fixing this setting, the customer re-ran the scenario and the test passed without getting into the TimeoutException again. Here is the updated performance counter data:

As from this new graph, we noticed the following:
1) The number of concurrent clients has been increased. The max "Requests Executing" now is 457.
2) The system reached much higher concurrent requests on both the front-end and the backend servers, which is great. For example, the average “Requests Executing” is 42 now. This is a good symptom.
3) There was some high latency in the backend server. The max of “Calls Duration” for WCF service is 5.05 seconds. It is not far from the client timeout setting 20 seconds. For the front-end, it can reach 11 seconds. This may be a problem for the long running system. The backend service must have done some heavy-weighted work. We need to either increase the timeout or optimize the backend service logic more to make it faster.
4) The good news is that much higher CPU usage on both frontend and backend were observed. Apparently the system runs much more efficiently. Also higher throughput was observed from the system which was not recorded in the performance counters.
At this point, we have got the problem solved.