Learn Productivity Tips and Tricks for the Debugger in Visual Studio
Applies to: ![]() Visual Studio
Visual Studio ![]() Visual Studio for Mac
Visual Studio for Mac
Note
This article applies to Visual Studio 2017. If you're looking for the latest Visual Studio documentation, see Visual Studio documentation. We recommend upgrading to the latest version of Visual Studio. Download it here
Read this topic to learn a few productivity tips and tricks for the Visual Studio debugger. For a look at the basic features of the debugger, see First look at the debugger. In this topic, we cover some areas that are not included in the feature tour.
Pin data tips
If you frequently hover over data tips while debugging, you may want to pin the data tip for the variable to give yourself quick access. The variable stays pinned even after restarting. To pin the data tip, click the pin icon while hovering over it. You can pin multiple variables.

Edit your code and continue debugging (C#, VB, C++)
In most languages supported by Visual Studio, you can edit your code in the middle of a debugging session and continue debugging. To use this feature, click into your code with your cursor while paused in the debugger, make edits, and press F5, F10, or F11 to continue debugging.
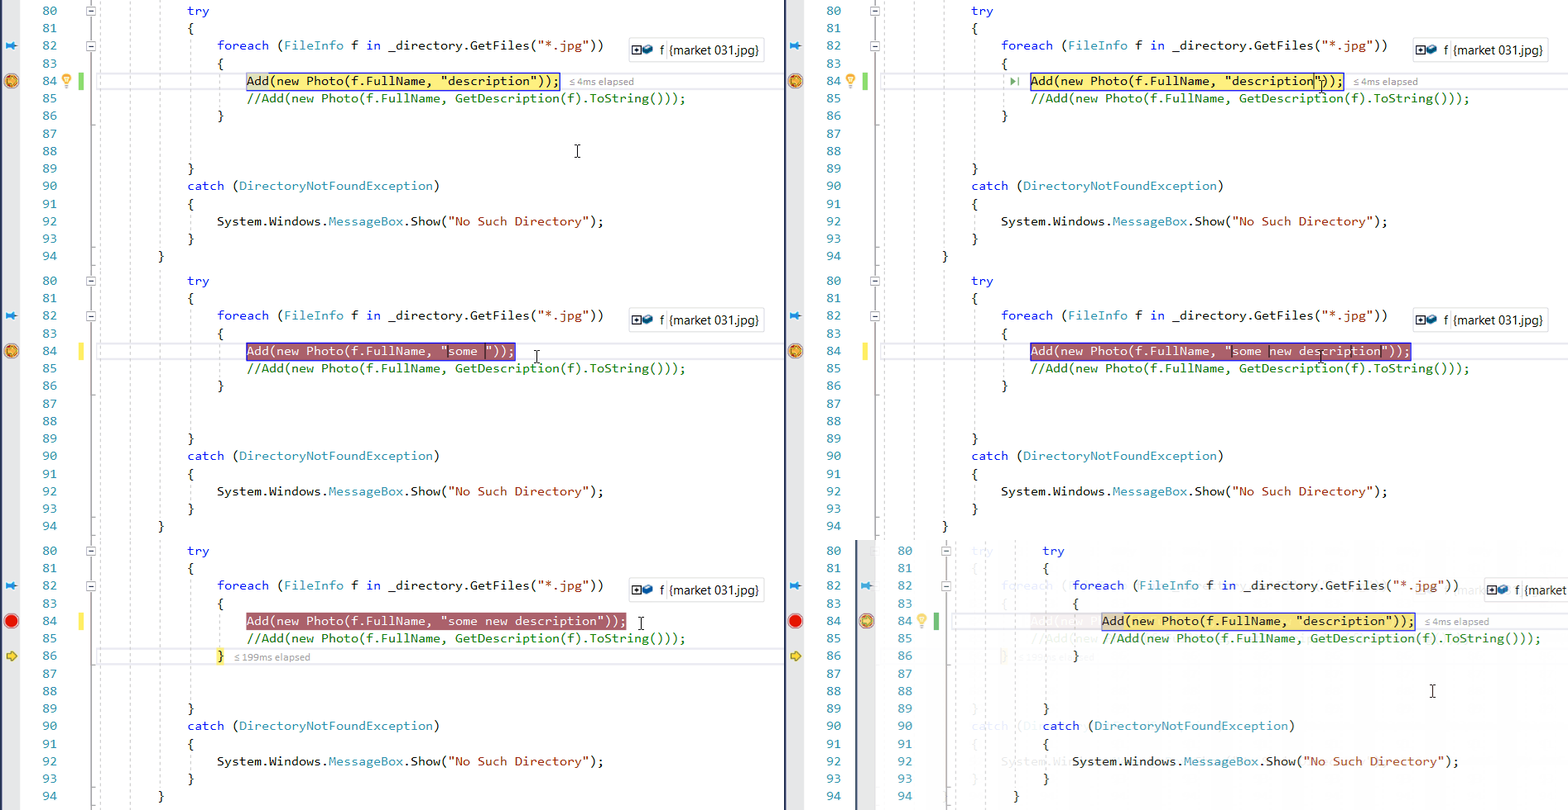
For more information on using the feature and on feature limitations, see Edit and Continue.
Edit XAML code and continue debugging
To modify XAML code during a debugging session, see Write and debug running XAML code with XAML Hot Reload.
Debug issues that are hard to reproduce
If it is difficult or time-consuming to recreate a particular state in your app, consider whether the use of a conditional breakpoint can help. You can use conditional breakpoints and filter breakpoints to avoid breaking into your app code until the app enters a desired state (such as a state in which a variable is storing bad data). You can set conditions using expressions, filters, hit counts, and so on.
To create a conditional breakpoint
Right-click a breakpoint icon (the red ball) and choose Conditions.
In the Breakpoint Settings window, type an expression.

If you are interested in another type of condition, select Filter instead of Conditional expression in the Breakpoint Settings dialog box, and then follow the filter tips.
Configure the data to show in the debugger
For C#, Visual Basic, and C++ (C++/CLI code only), you can tell the debugger what information to show using the DebuggerDisplay attribute. For C++ code, you can do the same using Natvis visualizations.
Change the execution flow
With the debugger paused on a line of code, use the mouse to grab the yellow arrow pointer on the left. Move the yellow arrow pointer to a different point in the code execution path. Then you use F5 or a step command to continue running the app.

By changing the execution flow, you can do things like test different code execution paths or rerun code without restarting the debugger.
Warning
Often you need to be careful with this feature, and you see a warning in the tooltip. You may see other warnings, too. Moving the pointer cannot revert your app to an earlier application state.
Track an out-of-scope object (C#, Visual Basic)
It's easy to view variables using debugger windows like the Watch window. However, when a variable goes out of scope in the Watch window, you may notice that it is grayed out. In some app scenarios, the value of a variable may change even when the variable is out of scope, and you might want to watch it closely (for example, a variable may get garbage collected). You can track the variable by creating an Object ID for it in the Watch window.
To create an object ID
Set a breakpoint near a variable that you want to track.
Start the debugger (F5) and stop at the breakpoint.
Find the variable in the Locals window (Debug > Windows > Locals), right-click the variable, and select Make Object ID.

You should see a $ plus a number in the Locals window. This variable is the object ID.
Right-click the object ID variable and choose Add Watch.
For more information, see Create an Object ID.
View return values for functions
To view return values for your functions, look at the functions that appear in the Autos window while you are stepping through your code. To see the return value for a function, make sure that the function you are interested in has already executed (press F10 once if you are currently stopped on the function call). If the window is closed, use Debug > Windows > Autos to open the Autos window.

In addition, you can enter functions in the Immediate window to view return values. (Open it using Debug > Windows > Immediate.)
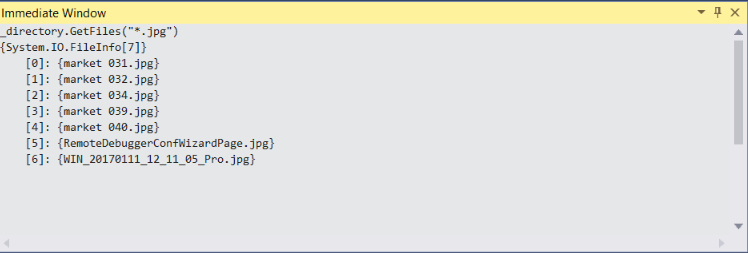
You can also use pseudovariables in the Watch and Immediate window, such as $ReturnValue.
Inspect strings in a visualizer
When working with strings, it can be helpful to view the entire formatted string. To view a plain text, XML, HTML, or JSON string, click the magnifying glass icon ![]() while hovering over a variable containing a string value.
while hovering over a variable containing a string value.

A string visualizer may help you find out whether a string is malformed, depending on the string type. For example, a blank Value field indicates the string is not recognized by the visualizer type. For more information, see String Visualizer Dialog Box.
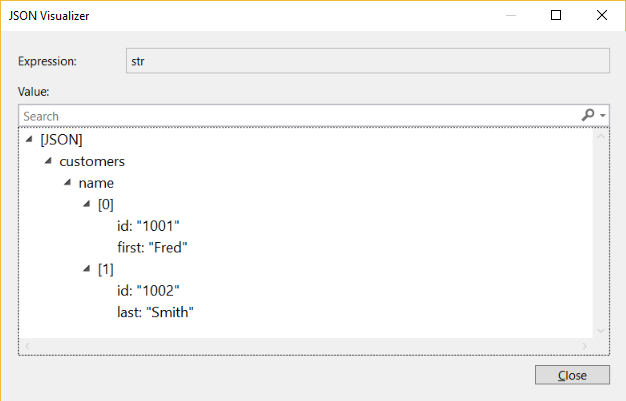
For a few other types such as DataSet and DataTable objects that appear in the debugger windows, you can also open a built-in visualizer.
Break into code on handled exceptions
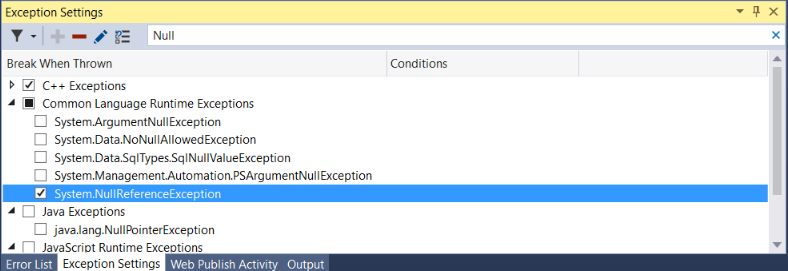
The debugger breaks into your code on unhandled exceptions. However, handled exceptions (such as exceptions that occur within a try/catch block) can also be a source of bugs and you may want to investigate when they occur. You can configure the debugger to break into code for handled exceptions as well by configuring options in the Exception Settings dialog box. Open this dialog box by choosing Debug > Windows > Exception Settings.
The Exception Settings dialog box allows you to tell the debugger to break into code on specific exceptions. In the illustration below, the debugger breaks into your code whenever a System.NullReferenceException occurs. For more information, see Managing exceptions.
Debug deadlocks and race conditions
If you need to debug the kinds of issues that are common to multithreaded apps, it often helps to view the location of threads while debugging. You can do this easily using the Show Threads in Source button.
To show threads in your source code
While debugging, click the Show Threads in Source button
 in the Debug toolbar.
Look at the gutter on the left side of the window. On this line, you see a thread marker icon
 that resembles two cloth threads. The thread marker indicates that a thread is stopped at this location.
Notice that a thread marker may be partially concealed by a breakpoint.
Hover the pointer over the thread marker. A DataTip appears. The DataTip tells you the name and thread ID number for each stopped thread.
You can also view the location of threads in the Parallel Stacks window.
Examine payloads for web services and network resources (UWP)
In UWP apps, you can analyze network operations performed using the Windows.Web.Http API. You can use this tool to help debug web services and network resources. To use the tool, select Debug > Performance Profiler. Select Network, and then choose Start. In your app, go through the scenario that uses Windows.Web.Http, and then choose Stop collection to generate the report.

Select an operation in the summary view to view more details.
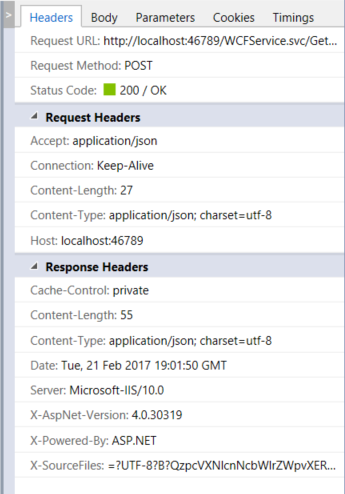
For more information, see Network Usage.
Get more familiar with how the debugger attaches to your app (C#, C++, Visual Basic, F#)
To attach to your running app, the debugger loads symbol (.pdb) files generated for the exact same build of the app you are trying to debug. In some scenarios, a little knowledge of symbol files can be helpful. You can examine how Visual Studio loads symbol files using the Modules window.
Open the Modules window while debugging by selecting Debug > Windows > Modules. The Modules window can tell you what modules the debugger is treating as user code, or My Code, and the symbol loading status for the module. In most scenarios, the debugger automatically finds symbol files for user code, but if you want to step into (or debug) .NET code, system code, or third-party library code, extra steps are required to obtain the correct symbol files.

You can load symbol information directly from the Modules window by right-clicking and choosing Load Symbols.
Sometimes, app developers ship apps without the matching symbol files (to reduce the footprint), but keep a copy of the matching symbol files for the build so that they can debug a released version later.
To find out how the debugger classifies code as user code, see Just My Code. To find out more about symbol files, see Specify symbol (.pdb) and source files in the Visual Studio debugger.
Learn more
For additional tips and tricks and more detailed information, see these blog posts: