Analyze performance of .NET asynchronous code
Applies to: ![]() Visual Studio
Visual Studio ![]() Visual Studio for Mac
Visual Studio for Mac
Note
This article applies to Visual Studio 2017. If you're looking for the latest Visual Studio documentation, see Visual Studio documentation. We recommend upgrading to the latest version of Visual Studio. Download it here
Use the .NET Async tool to analyze the performance of asynchronous code in your app.
Note
The .NET Async tool requires Visual Studio 2019 version 16.7 or later and a .NET project that uses async and await.
Setup
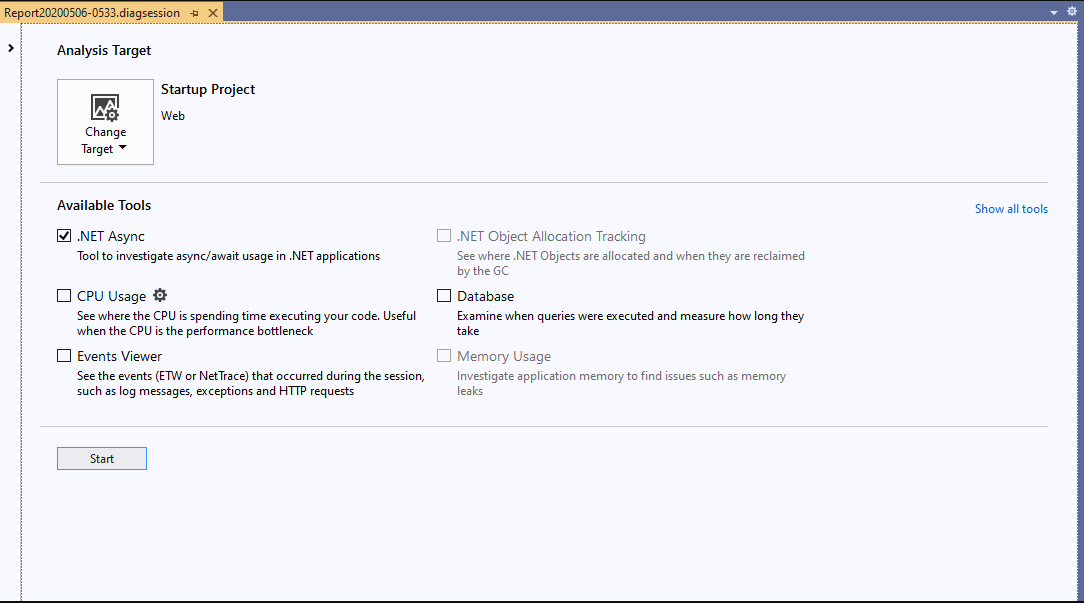
Select Alt+F2 to open the performance profiler in Visual Studio.
Select the .NET Async check box.

Click the Start button to run the tool.
After the tool starts running, go through the scenario you want to profile in your app. Then select Stop collection or close your app to see your data.
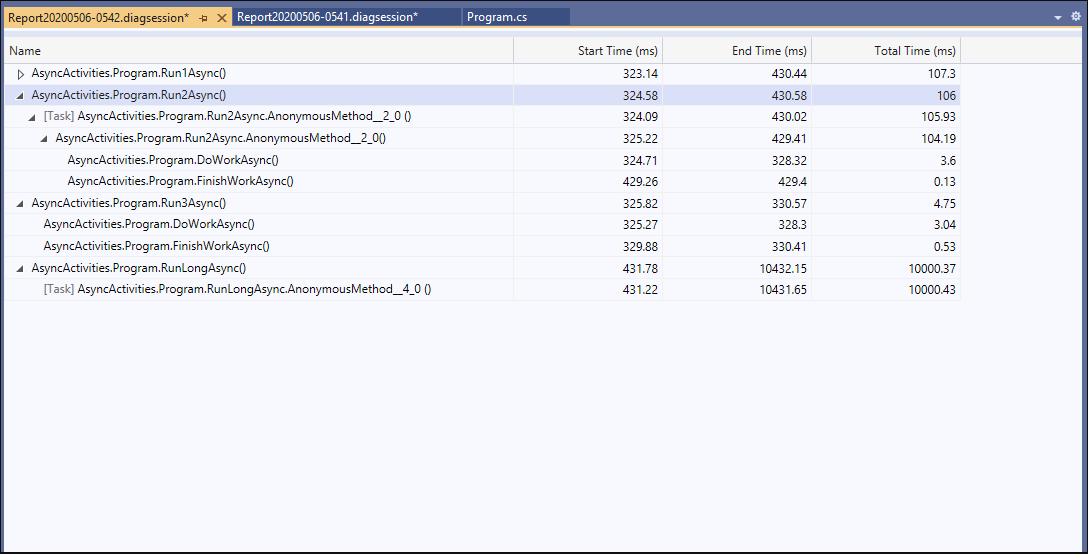
After collection stops, you see a table of the activities that happened during your profiling session.

Asynchronous events are organized into activities chronologically. Each displays its start time, end time, and duration.
Each row that corresponds to a task is labeled in the Name column. For any task name that can't be resolved, a Task in label appears. It's followed by the name of the method the task occurs within. If an asynchronous activity doesn't complete within the collection session, an Incomplete label appears in the End Time column.
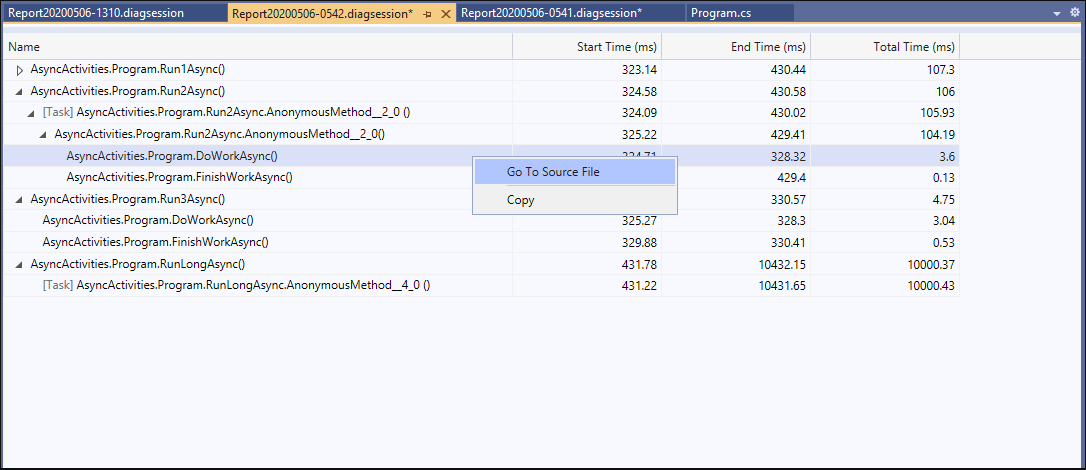
To further investigate a specific task or activity, right-click the row. Then select Go To Source File to see where in your code that activity happened.
