Debugging WPF applications in Visual Studio 2010 using WPF Tracing
In an earlier blog, I described how to use the new WPF Visualizer to debug WPF applications in Visual Studio 2010. We've added another feature that further improves the debugging experience for WPF applications. The Visual Studio 2010 debugger can now automatically display tracing information from a WPF application. Let's walk through a simple example and discuss the details later.
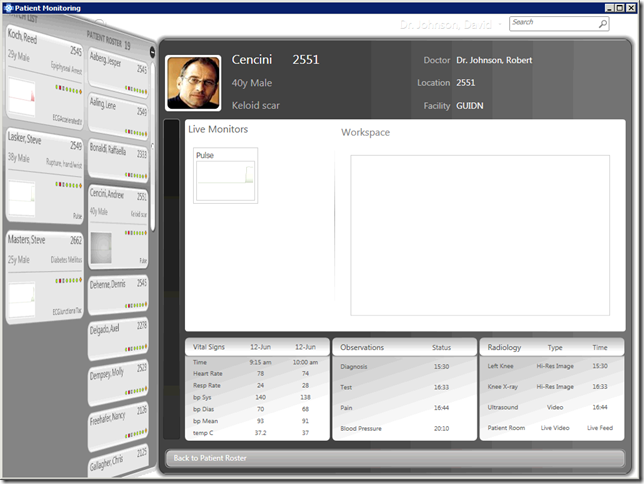
In this example, I have a WPF application (Patient Monitoring) and I'm trying to debug a data binding problem. Here is a screen shot showing the Patient Monitoring application.

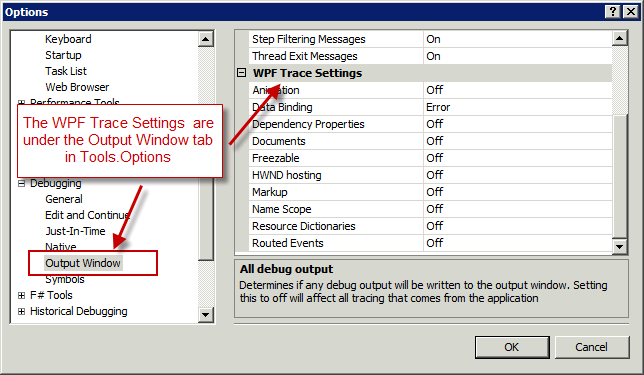
In order to view tracing information from a WPF application, the first step is to enable WPF tracing via Tools.Options.Debugging.Output Window. Once you have navigated to the Tools.Options dialog, select the Output Window node under the Debugging tab, as shown below.

In the screenshot above, you can see that there are a number of different tracing options for the WPF events, including Data Binding, Animation, Markup, etc. Since we are debugging a Data Binding failure, I'm going to enable the Data Binding option. Specifically, I'm going to set the Data Binding setting to "Error" meaning that I want the debugger to display WPF Data Binding events that have a tracing level of Critical or Error. Once this setting is enabled, you can press F5 to start the application under the debugger. While debugging your application, every time that there is a Data Binding failure, the debugger will log the error to the Output window, as shown here.
Each error contains a number followed by a description of the error. Using this information, I can now see that binding the XmlDataCollection to the LiveChartsListBox control is failing. It turns out that this happens every time that I click the patient details control, this failure happens. So now I can start debugging the problem from there.
One of the reasons why debugging a WPF application is more difficult than other application types is due to the fact that a lot of things happen behind the scenes. Take data binding for example which is an area where many developers struggle with when it comes to debugging. This is both a strength and a weakness of a declarative technology such as XAML which allows you to simply describe what you want to happen and the framework will figure out the how.
Habib Heydarian.
