Debugging Typescript in Visual Studio Code and Chrome
After a small adventure in a big data team I'm back in the Reporting Services team.
Everything is new and at the same times some things never change, but I found very quickly that SSRS is building the new portal with recent web technologies such as Angular and Typescript, check out the announcement here
I decided that I want to try to use Visual Studio code for modifying and debugging some of the new great portal features and I wasn't able to find any step by step guide to do it (I found how to debug node.js apps but not just browser apps), so I give it a shot and here are my results
Programs and basic setup
1. Install Node.js https://nodejs.org/en/
2. Install typescript https://www.typescriptlang.org/#Download
3. Install Visual Studio Code https://code.visualstudio.com/
4. Install TypeScript definitions manager https://definitelytyped.org/tsd/
5. Install the chrome debugging extension https://marketplace.visualstudio.com/items/msjsdiag.debugger-for-chrome
The easiest way to do it is to open the command palette (Ctrl+Shift+P) and type install extensions
6. Install typescript definitions for angular
Move to your application directory and execute
C:\Repos\VSCodeDebug>tsd install angular --resolve --save
7. Install the nodejs web server
C:\Repos\VSCodeDebug>npm install -g http-server
8. Start the nodejs web server and take note of the http port
C:\Repos\VSCodeDebug>http-server
Running and debugging
You can use your own app or clone my super simple demo app from here https://github.com/jtarquino/VSCodeDebug where I "typescripted" the demo in https://angularjs.org/ for databinding
1. Configure the task runner to compile typescript
Try to build (Ctrl+Shift+B )
it will show that no task runner is configure
Click in configure and it will take you to the task.json file
Comment out the Compiles HelloWorld.ts program task runner
Uncomment the second section , so you can use tsconfig.json for the parameters for the compiler
// A task runner that calls the Typescript compiler (tsc) and// compiles based on a tsconfig.json file that is present in // the root of the folder open in VSCode
Open tsconfig.json and ensure the sourceMap property is set to true, this will generate the sourceMap files which allows the degugger to map the javascript files with the typescript files
{"compilerOptions": {"sourceMap": true}}
2. Setup the debug, press f5 to start the debugging,
First time will ask for the environment pick Chrome
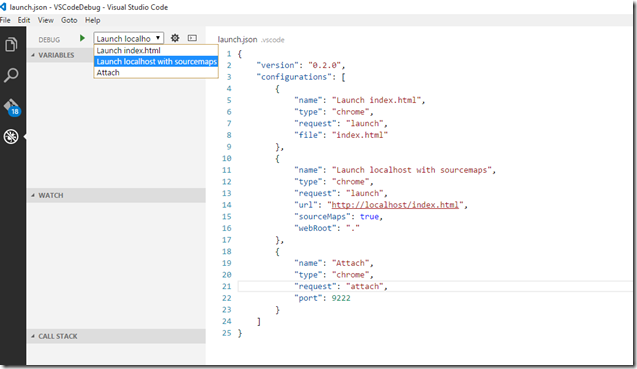
It will open the file launch.json, there are two important elements here the url and the webroot
url should be updated to your start page in my case is index.html
Update the port to use the one that the nodejs http server show when started ,in my case 8080
webroot should be the root of your application, it could be wwwroot or just the current directory, for my case is the current directory which is . (yes just a dot)
{"version": "0.2.0","configurations": [{"name": "Launch index.html","type": "chrome","request": "launch","file": "index.html"},{"name": "Launch localhost with sourcemaps","type": "chrome","request": "launch","url": "https://localhost:8080/index.html","sourceMaps": true,"webRoot": "."},{"name": "Attach","type": "chrome","request": "attach","port": 9222}]}
Go to the debug button in VScode and select "Launch Localhost with source maps"
3. Set breakpoints and run
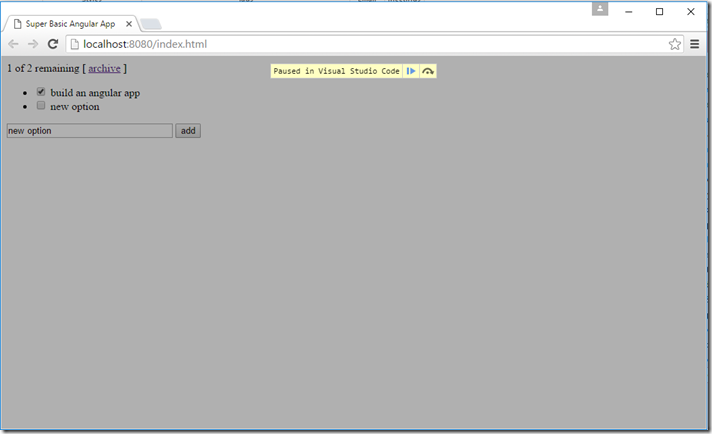
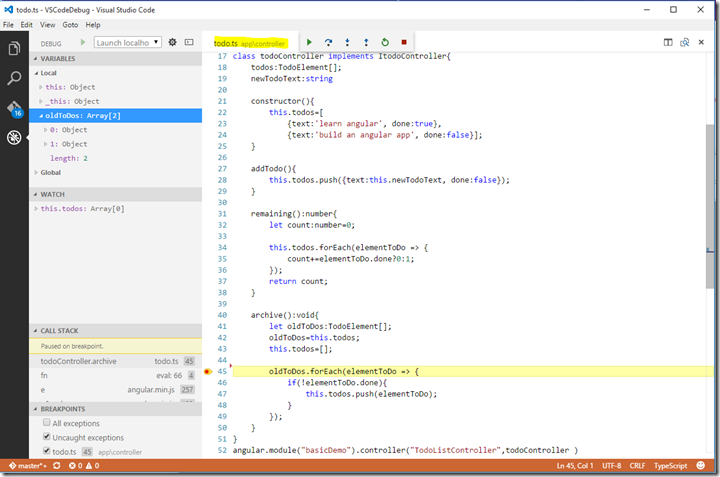
Press f5, it will open Chrome and it will stop at any breakpoint defined by you (for some weird reason you have to click on refresh at least one time before Chrome stops in the breakpoint)
Also important to notice that is debugging in the .ts as expected (instead of the .js that you get out of the box)
Comments
Anonymous
February 02, 2016
The comment has been removedAnonymous
February 02, 2016
I believe, this issue is related to this other link: github.com/.../60 Where some guy pointed out the existence of a virtual "source" directory filled with all the original .ts files. I emphasize there is no problem debugging those .ts files from Chrome Dev Tools but breakpoints in Visual Studio code do not fire. Best.- Anonymous
March 08, 2016
Alberto,Did you manage to fix the issue. I have the exact same issue as you described. - Anonymous
April 04, 2016
Did you ever get this to work? I'm facing the same issue...
- Anonymous
Anonymous
March 28, 2016
Hello Jaime, very good post. It is the first one that describes in detail, how to debug typescript in VSC. Unfortunately, I couldn't make it run. Could your please upload a sample project, where the debuggin works. I am using the following settings: { "version": "0.2.0", "configurations": [ { "name": "Launch index.html", "type": "chrome", "request": "launch", "file": "index.html" }, { "name": "Launch localhost with sourcemaps", "type": "chrome", "request": "launch", "url": "http://localhost:8080/index.html", "sourceMaps": true, "webRoot": "." }, { "name": "Attach", "type": "chrome", "request": "attach", "port": 9222 } ]}Thank you,Stoyan- Anonymous
June 20, 2016
Hi, the project I used is available in https://github.com/jtarquino/VSCodeDebug- Anonymous
July 24, 2016
I used the same project in the above link but still doesn't work. Any other suggestions. - Anonymous
August 29, 2016
Same problem, breakpoints doesn't work.
- Anonymous
- Anonymous
Anonymous
October 05, 2016
Hi all, I had problems getting 'Debugger for Chrome' working where my debug session wouldn't be able to connect to Chrome's remote debugger. The problem was that remote debugging wasn't started - this happens if you already have other Chrome windows open and Chrome background processes running, VS Code will fire up another instance with the same configuration (ignoring the request for remote debugging).Solution is to add the 'userDataDir' to the configuration in 'launch.json' and run Chrome in an isolated environment. More details here: https://martaver.github.io/technology/vscode-chrome-debugging/Anonymous
January 04, 2017
how can i debug in visual studio 2015 when using node.js- Anonymous
January 31, 2017
I haven't tried myself
- Anonymous
Anonymous
January 10, 2017
Thank you! This tutorial saved my day (night, to be more precise). The issue was that I forgot to launch the http-server and constantly was getting "localhost refused to connect" error with "could not resolve data:text/html,chromewebdata to a file under webRoot" in the console. This is the first (and only) tutorial I found that mentions the server and how to launch it for debugging purposes.Anonymous
January 25, 2017
This is long enough that I would like to print it to keep beside me while coding, but all of the pages come out blank. Could that be fixed?- Anonymous
January 31, 2017
to be honest never realized until you mentioned should be something with the template, try the landscape option
- Anonymous
Anonymous
January 28, 2017
Update the links, please.- Anonymous
January 31, 2017
Which one is broken? I tried them quickly and seem to be working
- Anonymous


