Did you know… What the Enable Address-Level Debugging option does? - #271
Under Tools – Options – Debugging – General, there’s the option Enable Address-Level Debugging.
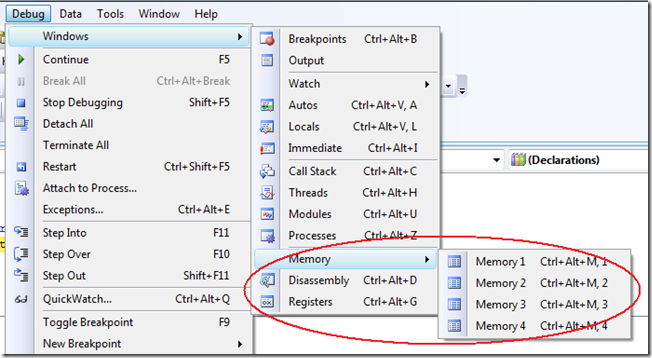
When checked, you get the following additional Debugger Tool Windows: Memory windows, Disassembly, and Registers.
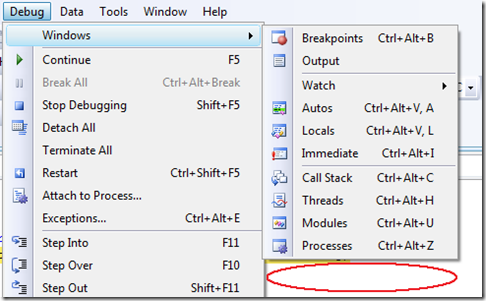
And when unchecked, you don’t get them.
Technorati Tags: VS2005Tip,VS2008Tip
Comments
Anonymous
July 31, 2008
With that option disabled, you also can't set memory breakpoints. I accidentally turned that off (probably hoping it would get rid of that prompt asking if I wanted to see disassembly) and could NOT figure out where the option to set memory breakpoints went.Anonymous
August 01, 2008
I have the option checked and only see three options in the Debug|Windows menu. Breakpoints Output ImmediateAnonymous
August 01, 2008
My latest in a series of the weekly, or more often, summary of interesting links I come across related to Visual Studio. Sara Ford's Tip of the Day #270 explains that you can have all processes break when one process breaks . Daniel Moth posted two coolAnonymous
September 04, 2008
Like Mike, I only see the three options: Breakpoints Output Immediate. I vaguely remember ONCE seeing those other options. Is there a flag that I had inadvertently set to disable those other windows? ThanksAnonymous
January 13, 2009
本篇包括tip271-tip290http://www.watch-life.net/visual-studio/visual-studio-2008-tip-day-28.html注:作者的ti...


