Using TFS, Excel, and Agile to deliver on time and on budget
We just finished our first real sprint using TFS, Excel, and the Agile process. One of the things that we had trouble doing in our last sprint, which wasn't really a sprint, but rather more of a marathon that seemed to never end, was shut down. We slipped our end date several times and each time was somewhat of a surprise for management, etc. This time around we decided to following a date driven Agile model and it worked out quite well. With TFS as the backbone of our project management and Excel (Iteration Backlog.xlsx that shipped with CTP12) as the front end, we were able to track daily/weekly progress easily. The Burndown chart and velocity chart helped us see if we were on track or not quickly and easily. We held daily stand ups to get face to face status and gut feel from everyone and then held weekly over view meetings to go over progress for the week. We were able to deliver what we said we would deliver when we said we were able to deliver and TFS, Excel and Agile were key in helping us do that.
TFS and Excel integration was a huge win for us. Although we struggled a bit at keeping our "Completed" and "Remaining" work up-to-date, after doing a post-mortem (See below for excerpts and custom chart from our post-mortem) on this sprint I believe the team now can really see the value of having accurate data to reflect back on to help us improve on the next sprint. Not only was there value in the post data analysis, but when the data was being kept up to date we could easily look at the burndown and velocity charts to see how the team was doing if we needed to make any course corrections or do some load balancing to keep on target. The iteration Backlog spreadsheet was able to sync with TFS and then did all the necessary calculations for us. We could see who was over or under utilized, our burndown, velocity, etc. The Iteration Backlog.xlsx spreadsheet which was shipped in Rosario CTP12 was a valuable tool for us.
There is a great webcast showing the use of TFS and the Product Backlog and Iteration Backlog spreadsheets in CTP12 at
https://teamsystemrocks.com/blogs/mickey_gousset/archive/2008/04/27/13967.aspx
To get CTP12 and play with the Iteration Backlog.xlsx go to https://www.microsoft.com/downloads/details.aspx?FamilyID=65D0E3BD-9DF3-421A-804F-8F01BD90F0B4&displaylang=en
Daily stand-ups were a great thing as well; possibly not too well received at first due to time and distraction, but in the end, I believe the team saw the benefit of these. Having daily stand ups really helped us make necessary course corrections, cut sub features, etc. in a timely manner so that we stayed on course to meet our end date which was a huge win for us. At first everyone was a little reluctant to do the daily standup due to time and disruption, but we grew to accept them more as the team saw my commitment to keep it to no more than 15 minutes and save the long design, or blocking issue discussions for after the stand up meeting so those not involved could go back and get focused on their tasks again with little disruption. The other advantage the team saw in having daily stand-ups was the value in face to face communication and the amount that we would learn from each other about issues being faced, or progress being made. On several occasions daily progress reports led to deeper discussions around what was really happening and what we needed to do keep on course. I highly recommend holding daily stand-ups.
Here's some excerpts from our post-mortem:
- What went well:
- Adjusting Tasks weekly (add/remove, remaining work)
- Communication between all disciplines
- Load balanced well
- Executed on plans
- What could have been improved
- Time tracking near end of Feature Crew
- Estimates could have been a little better - need more historical data
- Velocity could have been better/consistent
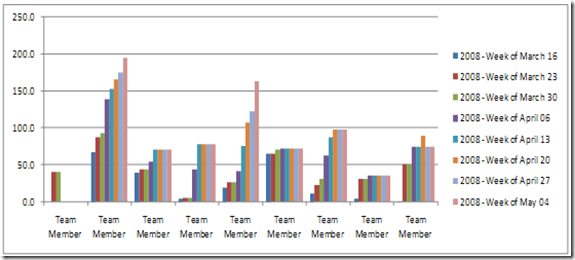
Here's a quick chart I put together to somewhat show each individual cumulative work using TFS Data Warehouse. This chart shows the cumulative Completed Work for each individual by week. The ideal chart would be a perfectly equal rise/step each week to show the velocity was consistent and goals were being met without overtime or too little effort. The real key to this chart and any chart is the data entered. Thus it is critical that everyone enter their data at the very least weekly so more accurate analysis can be done at the end. Also note that with TFS and the Reporting feature these charts are easily produced. Here's a link to a blog entry by a reporting Dev to help you get started using TFS Reporting -
https://blogs.msdn.com/teams_wit_tools/archive/2007/04/30/understanding-the-tfs-cube.aspx
In conclusion, I would highly recommend using TFS, Excel integration, and the Agile process to help you deliver on time and on budget.
-Larry
Comments
- Anonymous
June 05, 2008
Larry, a teammate of mine, just recently posted an entry around his experience using TFS for managing
