OpsMgr: Sample Template for a SQL Server 2008 Database Summary Dashboard
This post features a sample management pack that includes a dashboard template that I have put together recently and shared at the TechNet Gallery .
The display name of this management pack is Sample SQL Server 2008 Database Summary Dashboard Library, and it includes a dashboard template to allow users to configure and create an instance of a sample SQL Server 2008 Database Summary Dashboard for a selected group of SQL Server 2008 Database objects within minutes by just using the IT Pro Authoring UI in the Operations Console.
The sample dashboard created will only display the list of pre-selected SQL Server 2008 Database objects and their health states, provides detailed information and visualization on performance data collected (configured to show 2 days of performance data), using the performance tile widget component defined in the Visualization Component Extensions Library Management Pack.
Here is an example of how an instance of the sample SQL Server 2008 Database Summary Dashboard created using the template, for a selected group of SQL Server 2008 Database objects would look like:

Here are the steps to configure and create a Sample SQL Server 2008 Database Summary Dashboard for a group of SQL Server 2008 Database objects using the template:
Create a group or groups of SQL Server 2008 Database objects (using dynamic or static membership) and save them in their corresponding management packs, for example:


Import the sample management pack:

Importing the management pack will allow the dashboard template to appear under the "All Templates" folder in the "New Dashboard and Widget Wizard":

Hence, to create new dashboard and save them into the management pack(s) created in (1.), select the "Dashboard View" option to create a custom dashboard under the custom management pack’s folder:

Then, select the above template (SQL Server 2008 DB Summary Dashboard) in the custom folder (WeiOutThere Samples).
Enter a name for the custom dashboard:

Select any pre-populated group of SQL Server 2008 Database objects created in (1.), as the scope for the summary dashboard template:


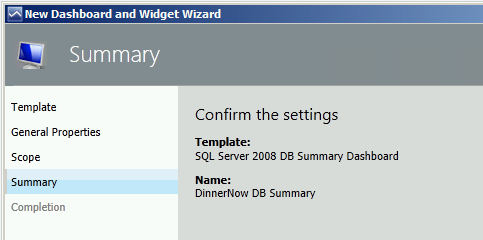
Standard Summary page:

… and that's it !!!
The steps to create a new sample summary dashboard for another group of SQL Server 2008 Database objects will be exactly the same:


Presentation Reminder:
In order for the Performance Tiles in the top 4 rows to display their health states (Green, Yellow or Red), the corresponding monitors that target the SQL Server 2008 Database class that are disabled by default, must be enabled.
Performance Tile (from left)
Associated Performance Counter
Corresponding Monitor
Default Setting
Performance Tile 1
DB Allocated Size (MB)
Database Status
Enabled
Performance Tile 2
DB Total Free Space (%)
DB Total Space
Disabled
Performance Tile 3
DB Avg. Disk ms/Read
Disk Read Latency
Disabled
Performance Tile 4
DB Avg. Disk ms/Write
Disk Write Latency
Disabled
Happy dashboarding !
Some useful links:
Sample Logical Disk Summary Dashboard Management Pack:
https://blogs.msdn.com/b/wei_out_there_with_system_center/archive/2013/12/19/opsmgr-sample-logical-disk-summary-dashboard-management-pack.aspx
Sample Customizable SQL Server 2008 Databases Summary Dashboard
https://blogs.msdn.com/b/wei_out_there_with_system_center/archive/2014/03/17/opsmgr-sample-customizable-sql-server-2008-databases-summary-dashboard.aspx
Operations Manager Management Pack Authoring - Dashboards
https://social.technet.microsoft.com/wiki/contents/articles/18657.operations-manager-management-pack-authoring-dashboards.aspx
Disclaimer:
All information on this blog is provided on an as-is basis with no warranties and for informational purposes only. Use at your own risk. The opinions and views expressed in this blog are those of the author and do not necessarily state or reflect those of my employer.
Comments
Anonymous
June 25, 2014
Hi Wei, I was trying to import the management pack to a Windows 2012 SP1 system, however i get issues saying the Microsoft.SystemCenter.Visualization.Configuration.Libary needs to be 7.1.10226.0 this as far as i can tell is only available in R2. Can you confirm your MP will only work with an R2 environment. ChrisAnonymous
June 29, 2014
Hi Chris, thanks for your support. Were you trying to import the MP to a SCOM 2012 SP1 environment and you see the above error message ? If so, yes, the MP shared at the TechNet gallery is currently only compatible for SCOM 2012 R2 as it uses the latest visualization libraries as its reference. I have created a SCOM 2012 SP1 compatible MP for my customer to try out a few weeks ago. If you are still interested, I can share it out :)Anonymous
September 08, 2014
Hi Wei This perfect for what we need..... however once setup, all the performance tiles state 'no data' ? The 'Selected SQL Server 2008 Databases' and 'Selected Database Details' are showing information, it just the Performance tiles are empty.... I've enabled the Corresponding Monitors for the perf counters, and have a custom group with some 2008 DBs as members. Can you help?Anonymous
September 14, 2014
The comment has been removedAnonymous
September 14, 2014
The comment has been removedAnonymous
September 14, 2014
The comment has been removedAnonymous
September 16, 2014
The comment has been removedAnonymous
February 01, 2015
The comment has been removed