OpsMgr: SQL Server Visualization Library with Legacy Components Now Available
Back in November this year, the SQL Server Engineering Team released the latest version (6.6.4.0) of the SQL Server and Replication management packs. In addition to health monitoring capabilities, this management pack includes new and enhanced summary dashboards for SQL Server 2008 and 2012, and a datacenter dashboard template to allow users to create custom dashboards with the same visualization capabilities for other components or applications monitored by their Operations Manager environment.

The datacenter dashboard template and the new summary dashboards are based on a new standalone WPF/Silverlight application component defined in the SQL Server Visualization Library management pack from version 6.6.0.0 onwards. Since version 6.6.2.0, the components used to define the previous versions of the SQL Server summary dashboards (multi widget/component) have been deprecated and removed from the main SQL Server Visualization Library management pack. Therefore, importing any versions of this library management pack from 6.6.2.0 onwards into an Operations Manager management group would remove all the legacy components. Hence, custom dashboard created referencing the legacy components would be affected and would either show up as blank tiles or lose certain functionalities after say, version 6.6.4.0 of the SQL Server Visualization Library was imported.
THANKFULLY, the SQL Server Engineering Team has recently released a standalone and independent version of the visualization library for the community. This visualization library consist of all legacy components previously used to define the summary dashboards for SQL Server 2008 and 2012 up till version 6.5.4.0.
The file name of the visualization library with legacy components is: Microsoft.Legacy.SQLServer.Visualization.Library.mpb, version 6.6.0.1, and it can now be downloaded from the TechNet Gallery.
This legacy library management pack is independent from the current versions of the SQL Server Visualization management pack and can be imported or removed separately, without being affected by any updates or changes to the current versions going forward.
This is good because this legacy visualization library consists of individual components that allow more granularity and control as these components can be referenced in other custom dashboard to provide further insights and richness in context with monitored objects and monitoring data.
I have some examples on my blog that demonstrates these capabilities using an XML authoring or a template approach.
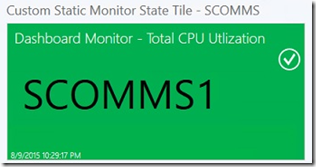
The following is an example of some custom widgets created based on the performance tile and monitor state tile components defined in the Microsoft Legacy SQL Server Visualization Library management pack:


Note that I will be doing some simple modifications to some of the sample summary dashboards and templates created previously for this blog to now reference the Microsoft.Legacy.SQLServer.Visualization.Library. An update will be provided in my next blog post.
Thanks again to the SQL Server Engineering Team for releasing this SQL Server Visualization Library with the Legacy Components and allowing me to share it with the community.
Happy holidays to all !
Disclaimer:
All information on this blog is provided on an as-is basis with no warranties and for informational purposes only. Use at your own risk. The opinions and views expressed in this blog are those of the author and do not necessarily state or reflect those of my employer.
Comments
- Anonymous
January 26, 2016
Did you ever post an example of how to use the widget from this Management Pack?