教學課程:建立、評估流失率預測模型及評分
本教學課程提供 Microsoft Fabric 中 Synapse 資料科學工作流程的端對端範例。 此案例會建置模型來預測銀行客戶是否流失。 流失率或流失比率涉及銀行客戶停止銀行業務的比率。
本教學課程涵蓋了下列步驟:
- 安裝自訂程式庫
- 載入資料
- 藉助探索式資料分析來了解和處理資料,並顯示 Fabric Data Wrangler 功能的用法
- 使用 scikit-learn 和 LightGBM 來定型機器學習模型,並使用 MLflow 和 Fabric 自動記錄功能追蹤實驗
- 評估並儲存最終的機器學習模型
- 使用 Power BI 視覺效果顯示模型效能
必要條件
取得 Microsoft Fabric 訂用帳戶。 或註冊免費的 Microsoft Fabric 試用版。
登入 Microsoft Fabric。
使用首頁左側的體驗切換器,切換至 Synapse 資料科學體驗。
![體驗切換器功能表的螢幕擷取畫面,顯示選取 [資料科學] 的位置。](media/tutorial-data-science-prepare-system/switch-to-data-science.png)
- 如有必要,請建立 Microsoft Fabric lakehouse,如在 Microsoft Fabric 中建立 lakehouse 中所述。
遵循筆記本中的指示
您可以選擇下列選項之一,以遵循筆記本中的指示操作:
- 在資料科學體驗中開啟並執行內建筆記本
- 將筆記本從 GitHub 上傳至資料科學體驗
開啟內建筆記本
本教學課程隨附範例客戶流失率筆記本。
在 Synapse 資料科學體驗中開啟教學課程的內建範例筆記本:
移至 Synapse 資料科學首頁。
選取 [使用範例]。
選取對應的範例︰
- 如果範例適用於 Python 教學課程,則從預設的端對端工作流程 (Python) 索引標籤選取。
- 如果範例適用於 R 教學課程,則從端對端工作流程索引標籤選取。
- 如果範例適用於快速教學課程,則從快速教學課程索引標籤選取。
從 GitHub 匯入筆記本
本教學課程隨附 AIsample - Bank Customer Churn.ipynb 筆記本。
若要開啟本教學課程隨附的筆記本,請遵循為資料科學教學課程準備系統中的指示,將筆記本匯入您的工作區。
如果您想要複製並貼上此頁面中的程式碼,則可以建立新的筆記本。
開始執行程式碼之前,請務必將 Lakehouse 連結至筆記本。
步驟 1:安裝自訂程式庫
針對機器學習模型開發或臨機操作資料分析,您可能需要快速安裝 Apache Spark 工作階段的自訂程式庫。 安裝程式庫有兩個選項。
- 使用筆記本的內嵌安裝功能 (
%pip或%conda),僅在您目前的筆記本中安裝程式庫。 - 或者,您可以建立 Fabric 環境,從公用來源安裝程式庫,或將自訂程式庫上傳至該環境,然後您的工作區管理員可將環境連結為工作區的預設值。 環境中的所有程式庫隨後可供在工作區中的任何筆記本和 Spark 工作定義使用。 如需有關環境的詳細資訊,請參閱在 Microsoft Fabric 中建立、設定和使用環境。
在本教學課程中,使用 %pip install 在您的筆記本中安裝 imblearn 程式庫。
注意
執行 %pip install 之後,PySpark 核心會重新啟動。 在執行任何其他資料格之前,請先安裝所需的程式庫。
# Use pip to install libraries
%pip install imblearn
步驟 2:載入資料
churn.csv 中的資料集包含 10,000 個客戶的流失狀態,以及 14 個屬性,包括:
- 信用分數
- 地理位置 (德國、法國、西班牙)
- 性別 (男性、女性)
- 年齡
- 會員年資 (客戶成為該銀行客戶的年數)
- 帳戶餘額
- 估算薪資
- 客戶透過銀行購買的產品數目
- 信用卡狀態 (客戶是否有信用卡)
- 作用中成員狀態 (人員是否為作用中的銀行客戶)
資料集也包含資料列號碼、客戶識別碼和客戶姓氏資料行。 這些資料行中的值不應影響客戶離開銀行的決定。
客戶銀行賬戶關閉事件即會定義該客戶的流失。 資料集 Exited 資料行是指客戶的放棄。 由於這些屬性的內容很少,因此我們不需要資料集的背景資訊。 我們的目的旨在了解這些屬性如何參與 Exited 狀態。
在 10,000 名客戶中,只有 2037 名客戶 (約 20%) 離開銀行。 由於類別不平衡比例,建議您產生綜合資料。 混淆矩陣精確度可能與不平衡分類沒有相關性。 我們可能想要 Area Under the Precision-Recall Curve (AUPRC) 來測量精確度。
- 下表顯示
churn.csv資料的預覽:
| CustomerID | Surname | CreditScore | 地理位置 | 性別 | Age | 任職期間 | 餘額 | NumOfProducts | HasCrCard | IsActiveMember | EstimatedSalary | Exited |
|---|---|---|---|---|---|---|---|---|---|---|---|---|
| 15634602 | Hargrave | 619 | 法國 | 女性 | 42 | 2 | 0.00 | 1 | 1 | 1 | 101348.88 | 1 |
| 15647311 | Hill | 608 | 西班牙 | 女性 | 41 | 1 | 83807.86 | 1 | 0 | 1 | 112542.58 | 0 |
下載資料集並上傳至 Lakehouse
定義這些參數,以便您搭配不同的資料集使用此筆記本:
IS_CUSTOM_DATA = False  # If TRUE, the dataset has to be uploaded manually

IS_SAMPLE = False  # If TRUE, use only SAMPLE_ROWS of data for training; otherwise, use all data
SAMPLE_ROWS = 5000  # If IS_SAMPLE is True, use only this number of rows for training

DATA_ROOT = "/lakehouse/default"
DATA_FOLDER = "Files/churn"  # Folder with data files
DATA_FILE = "churn.csv"  # Data file name
此程式碼會下載公開可用的資料集版本,然後將該資料集儲存在 Fabric Lakehouse 中:
重要
在執行筆記本之前,新增 Lakehouse 至筆記本。 無法執行這項操作時,將會發生錯誤。
import os, requests
if not IS_CUSTOM_DATA:
# With an Azure Synapse Analytics blob, this can be done in one line

# Download demo data files into the lakehouse if they don't exist
    remote_url = "https://synapseaisolutionsa.blob.core.windows.net/public/bankcustomerchurn"
    file_list = ["churn.csv"]
    download_path = "/lakehouse/default/Files/churn/raw"

    if not os.path.exists("/lakehouse/default"):
        raise FileNotFoundError(
            "Default lakehouse not found, please add a lakehouse and restart the session."
        )
    os.makedirs(download_path, exist_ok=True)
    for fname in file_list:
        if not os.path.exists(f"{download_path}/{fname}"):
            r = requests.get(f"{remote_url}/{fname}", timeout=30)
            with open(f"{download_path}/{fname}", "wb") as f:
                f.write(r.content)
    print("Downloaded demo data files into lakehouse.")
開始記錄執行此筆記本所需的時間:
# Record the notebook running time
import time

ts = time.time()
從 Lakehouse 讀取未經處理資料
此程式碼會從 Lakehouse [檔案] 區段讀取未經處理資料,並針對不同的日期部分新增更多資料行。 建立資料分割的差異資料表會使用此資訊。
df = (
    spark.read.option("header", True)
    .option("inferSchema", True)
    .csv("Files/churn/raw/churn.csv")
    .cache()
)
從資料集建立 Pandas DataFrame
此程式碼會將 Spark DataFrame 轉換成 pandas DataFrame,以便更輕鬆地處理和取得視覺效果:
df = df.toPandas()
步驟 3:執行探索式資料分析
顯示未經處理資料
使用 display 探索未經處理資料,計算一些基本統計資料並顯示圖表檢視。 您必須先匯入必要的資料視覺效果程式庫,例如 seaborn。 Seaborn 是 Python 資料視覺效果程式庫,並提供高階介面,可在 DataFrame 和陣列上建置視覺效果。
import seaborn as sns
sns.set_theme(style="whitegrid", palette="tab10", rc = {'figure.figsize':(9,6)})
import matplotlib.pyplot as plt
import matplotlib.ticker as mticker
from matplotlib import rc, rcParams
import numpy as np
import pandas as pd
import itertools
display(df, summary=True)
使用 Data Wrangler 執行初始資料清理
直接從筆記本啟動 Data Wrangler,以探索及轉換 Pandas DataFrame。 在筆記本功能區 [資料] 索引標籤中,使用 [Data Wrangler] 下拉式清單提示來瀏覽可供編輯的已啟用 Pandas DataFrame。 選取您想要在 Data Wrangler 中開啟的 DataFrame。
注意
當筆記本核心忙碌時,無法開啟 Data Wrangler。 必須先完成儲存格執行,才能啟動 Data Wrangler。 深入了解 Data Wrangler。

Data Wrangler 啟動時,會產生資料面板的描述性概觀,如下圖所示。 概觀包含 DataFrame 維度、任何遺漏值等的相關資訊。您可以使用 Data Wrangler 來產生指令碼,以卸除遺漏值的資料列、重複的資料列,以及具有特定名稱的資料行。 然後,可以將指令碼複製到儲存格中。 下一個儲存格會顯示複製的指令碼。
![顯示 [Data Wrangler] 功能表的螢幕擷取畫面。](media/tutorial-bank-churn/menu-data-wrangler.png)
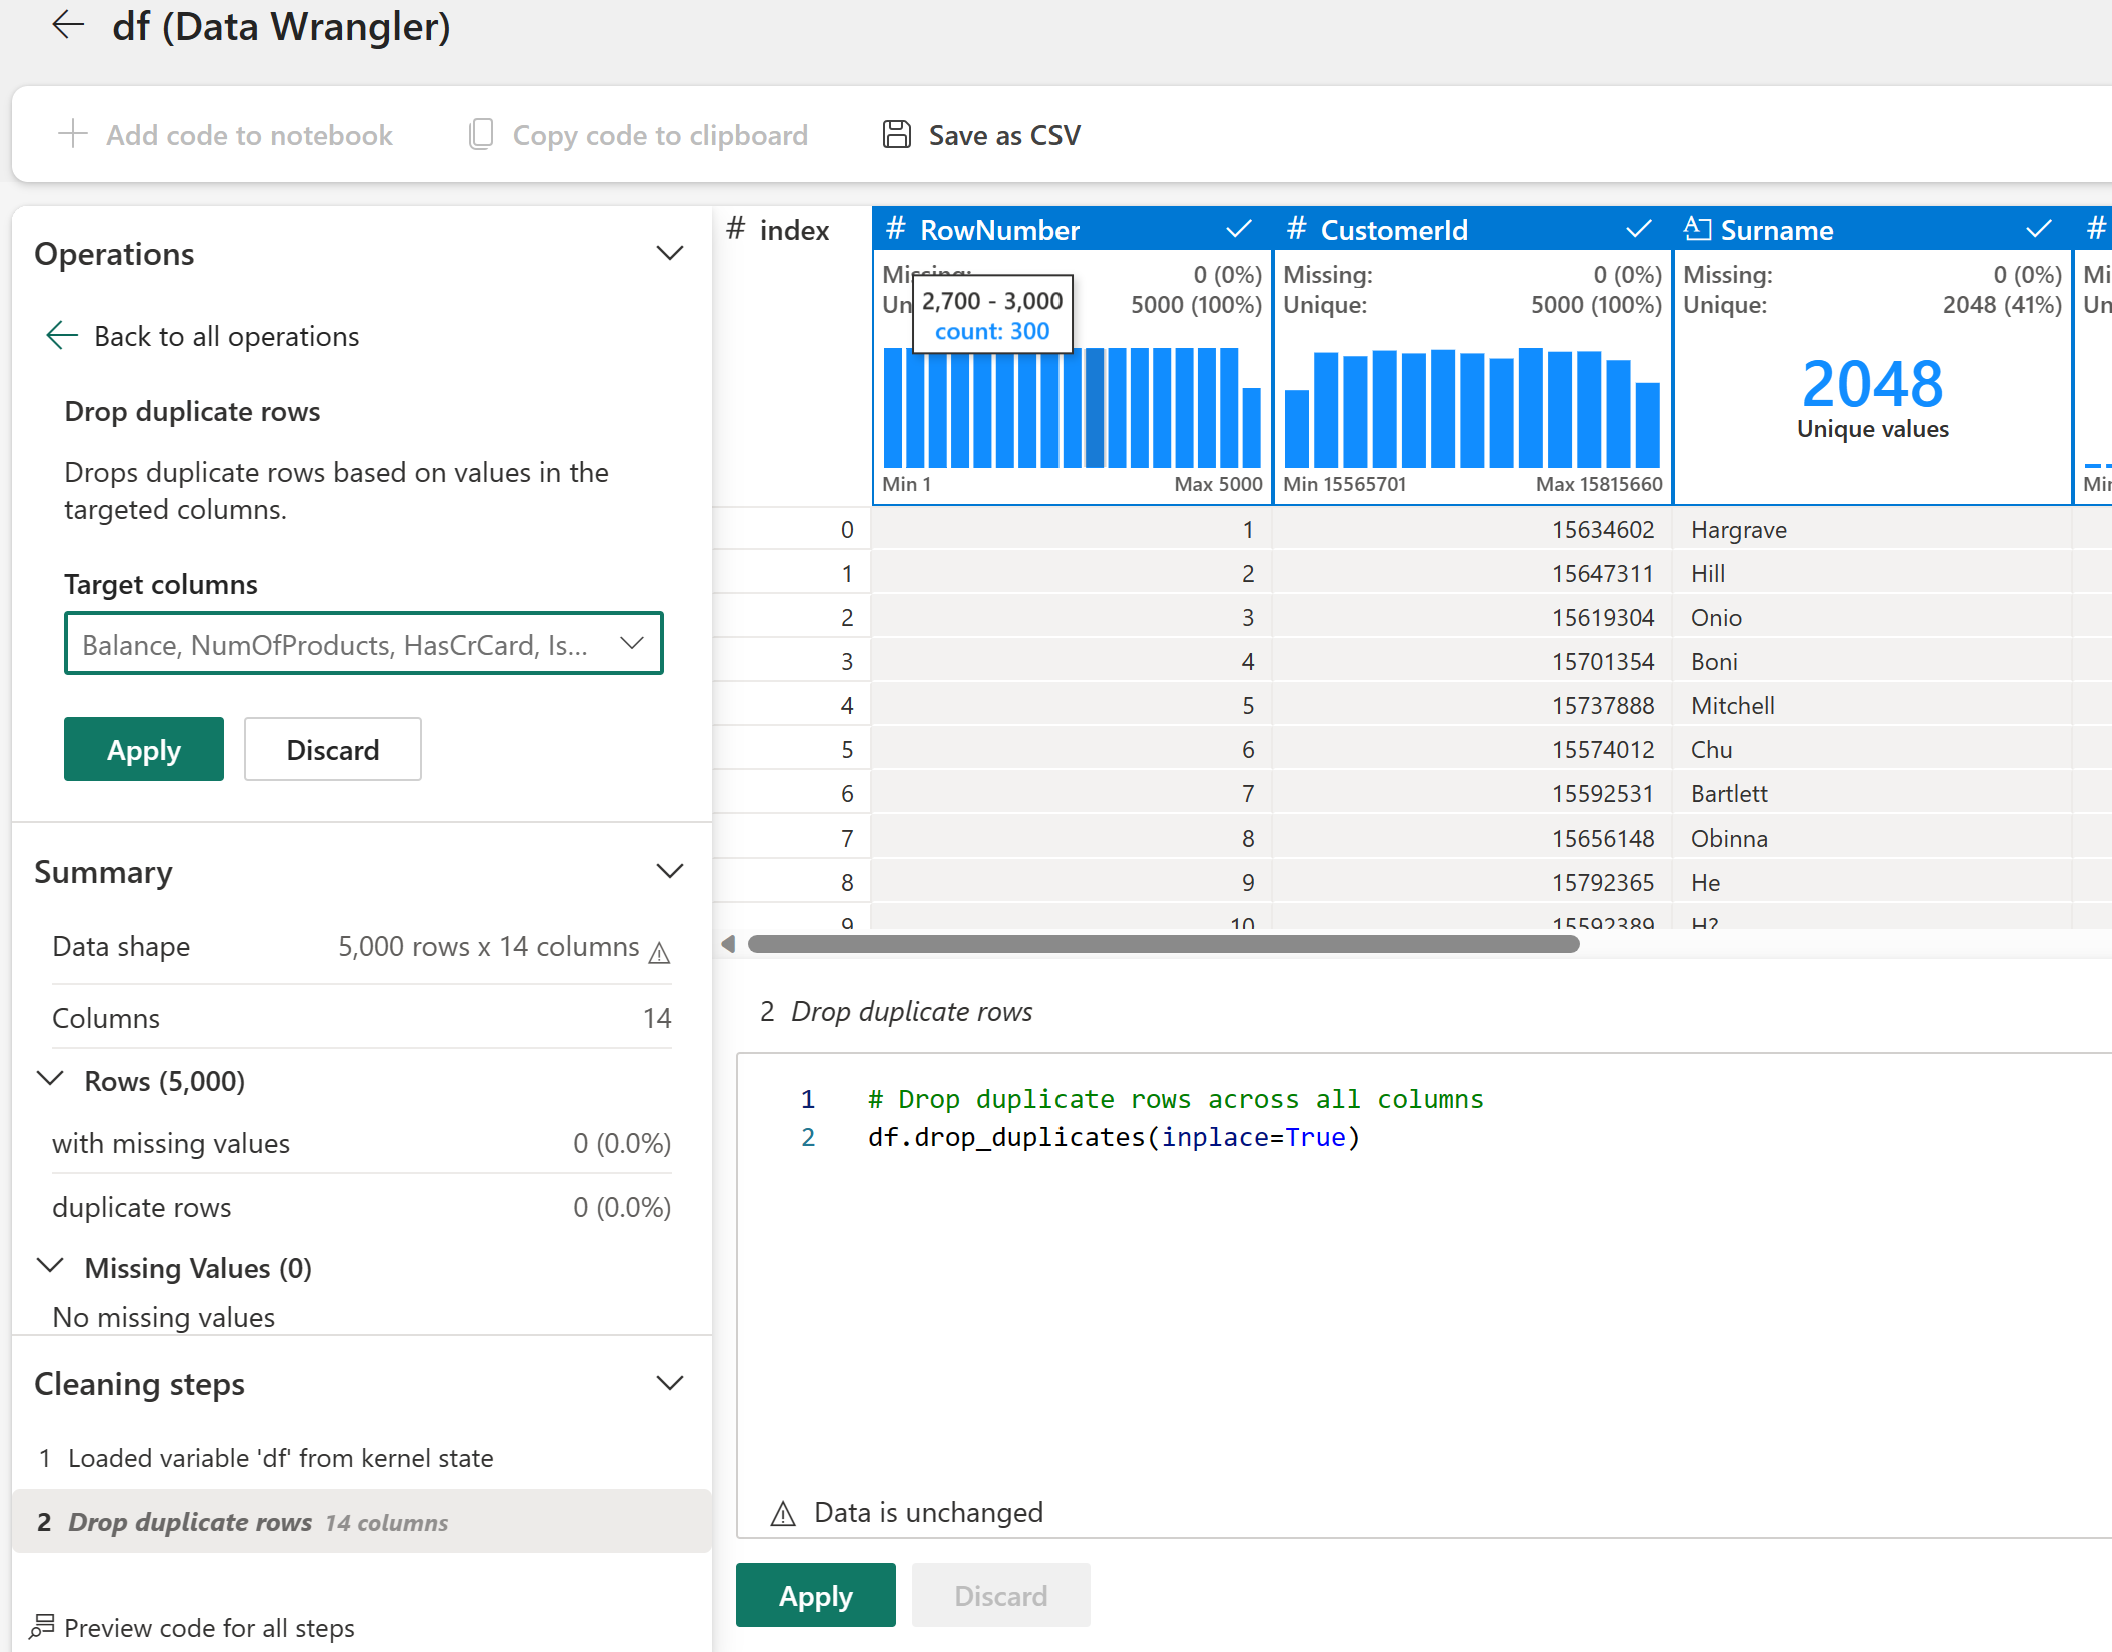
def clean_data(df):
    # Drop rows with missing data across all columns
    df.dropna(inplace=True)
    # Drop duplicate rows in columns: 'RowNumber', 'CustomerId'
    df.drop_duplicates(subset=['RowNumber', 'CustomerId'], inplace=True)
    # Drop columns: 'RowNumber', 'CustomerId', 'Surname'
    df.drop(columns=['RowNumber', 'CustomerId', 'Surname'], inplace=True)
    return df

df_clean = clean_data(df.copy())
判斷屬性
此程式碼用於判定類別、數值和目標屬性:
# Determine the dependent (target) attribute
dependent_variable_name = "Exited"
print(dependent_variable_name)
# Determine the categorical attributes
categorical_variables = [col for col in df_clean.columns if col in "O"
                        or df_clean[col].nunique() <=5
                        and col not in "Exited"]
print(categorical_variables)
# Determine the numerical attributes
numeric_variables = [col for col in df_clean.columns if df_clean[col].dtype != "object"
                        and df_clean[col].nunique() >5]
print(numeric_variables)
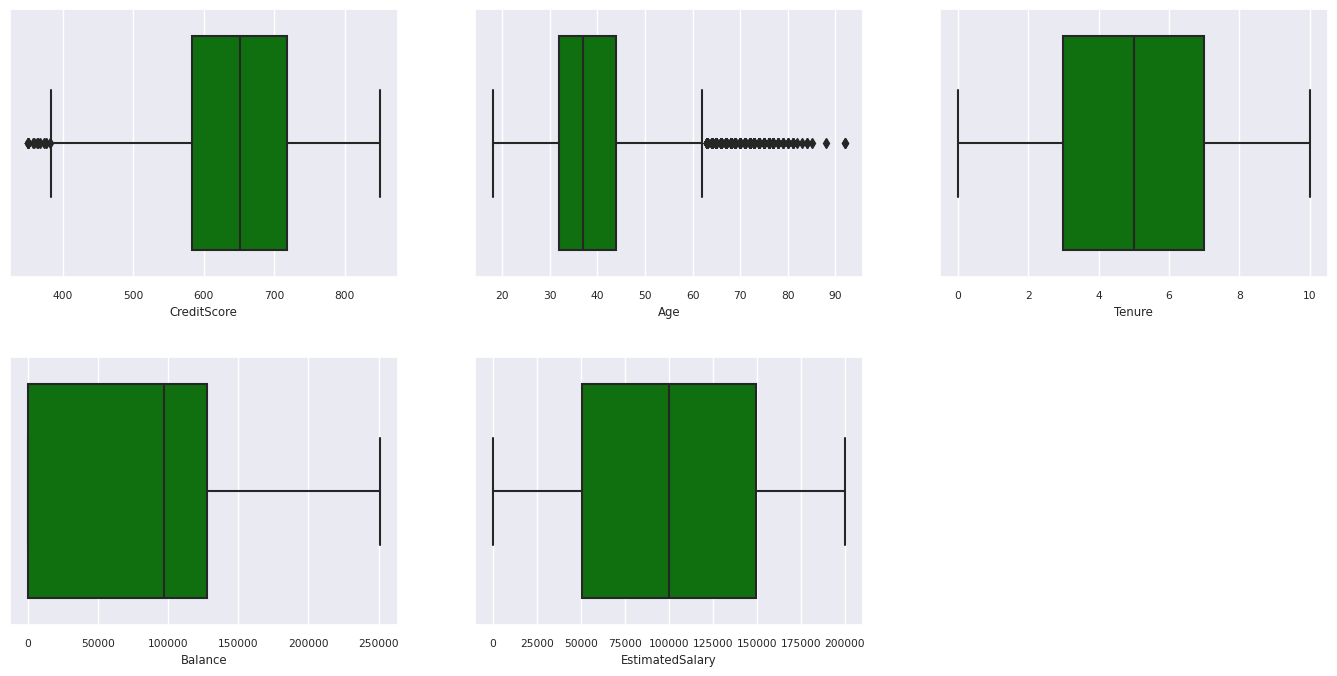
顯示五個數字摘要
使用盒狀圖來顯示五個數位摘要
- 最小的分數
- 第一個四分位數
- 中間值
- 第三分位數
- 最高分數
用於數值屬性。
df_num_cols = df_clean[numeric_variables]
sns.set(font_scale = 0.7)
fig, axes = plt.subplots(nrows = 2, ncols = 3, gridspec_kw =  dict(hspace=0.3), figsize = (17,8))
fig.tight_layout()
for ax,col in zip(axes.flatten(), df_num_cols.columns):
    sns.boxplot(x = df_num_cols[col], color='green', ax = ax)
# fig.suptitle('visualize and compare the distribution and central tendency of numerical attributes', color = 'k', fontsize = 12)
fig.delaxes(axes[1,2])
顯示離開和未離開客戶的分佈
顯示已離開與未離開客戶在類別屬性之間的分佈:
attr_list = ['Geography', 'Gender', 'HasCrCard', 'IsActiveMember', 'NumOfProducts', 'Tenure']
fig, axarr = plt.subplots(2, 3, figsize=(15, 4))
for ind, item in enumerate (attr_list):
    sns.countplot(x = item, hue = 'Exited', data = df_clean, ax = axarr[ind%2][ind//2])
fig.subplots_adjust(hspace=0.7)

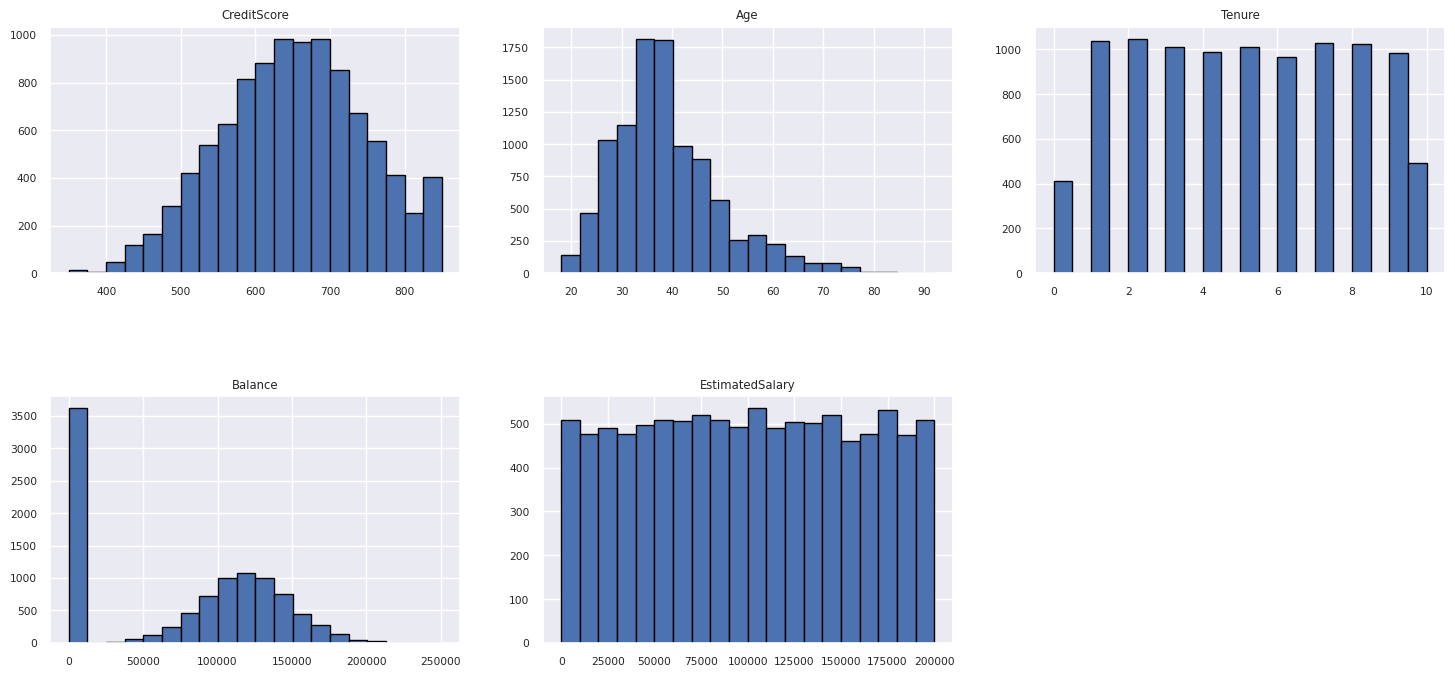
顯示了數值屬性的分佈
使用色階分佈圖顯示數值屬性的頻率分佈:
columns = df_num_cols.columns[: len(df_num_cols.columns)]
fig = plt.figure()
fig.set_size_inches(18, 8)
length = len(columns)
for i,j in itertools.zip_longest(columns, range(length)):
    plt.subplot((length // 2), 3, j+1)
    plt.subplots_adjust(wspace = 0.2, hspace = 0.5)
    df_num_cols[i].hist(bins = 20, edgecolor = 'black')
    plt.title(i)
# fig = fig.suptitle('distribution of numerical attributes', color = 'r' ,fontsize = 14)
plt.show()
執行特徵工程
特徵工程會根據目前屬性產生新的屬性:
df_clean["NewTenure"] = df_clean["Tenure"]/df_clean["Age"]
df_clean["NewCreditsScore"] = pd.qcut(df_clean['CreditScore'], 6, labels = [1, 2, 3, 4, 5, 6])
df_clean["NewAgeScore"] = pd.qcut(df_clean['Age'], 8, labels = [1, 2, 3, 4, 5, 6, 7, 8])
df_clean["NewBalanceScore"] = pd.qcut(df_clean['Balance'].rank(method="first"), 5, labels = [1, 2, 3, 4, 5])
df_clean["NewEstSalaryScore"] = pd.qcut(df_clean['EstimatedSalary'], 10, labels = [1, 2, 3, 4, 5, 6, 7, 8, 9, 10])
使用 Data Wrangler 執行獨熱編碼
透過先前討論的相同步驟來啟動 Data Wrangler,使用 Data Wrangler 來執行獨熱編碼。 此儲存格會顯示針對獨熱編碼所複製產生的指令碼:
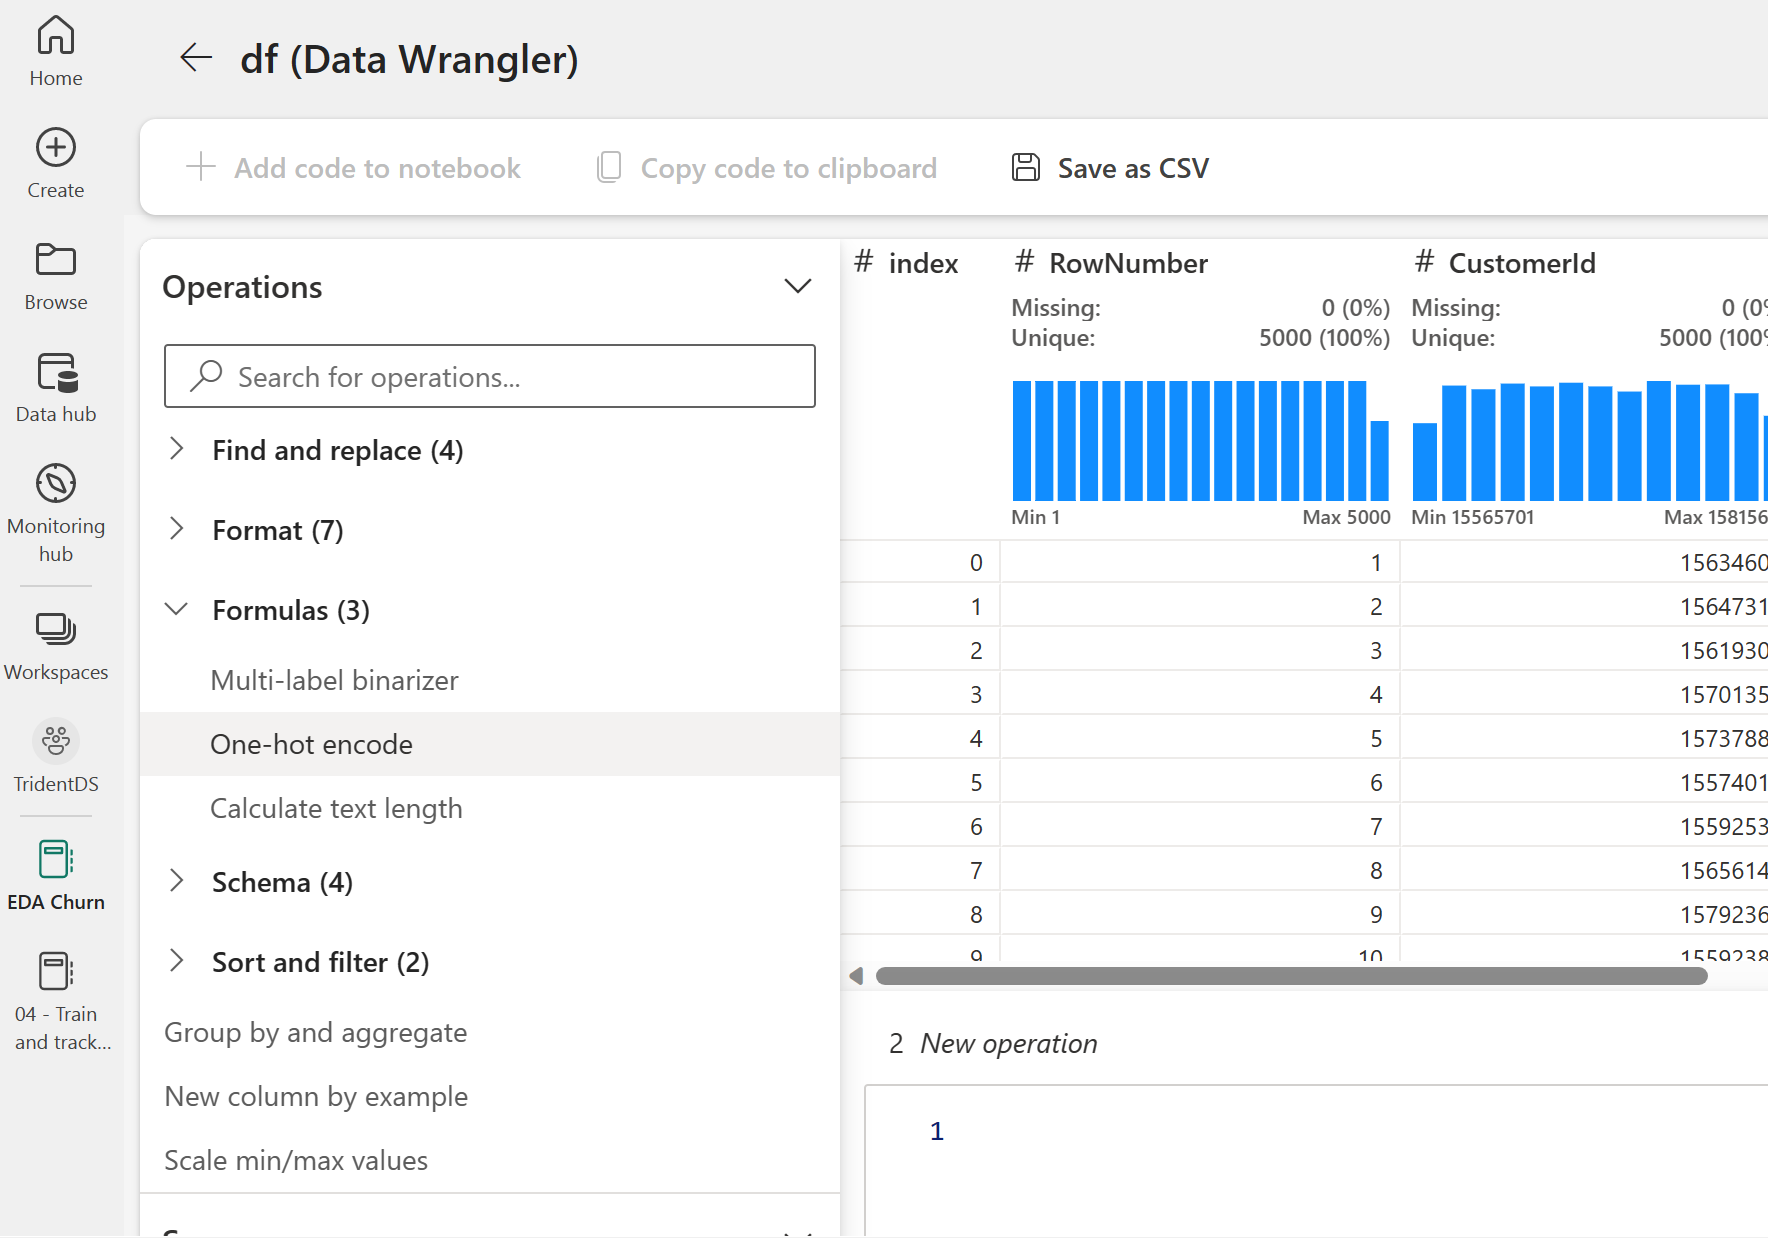
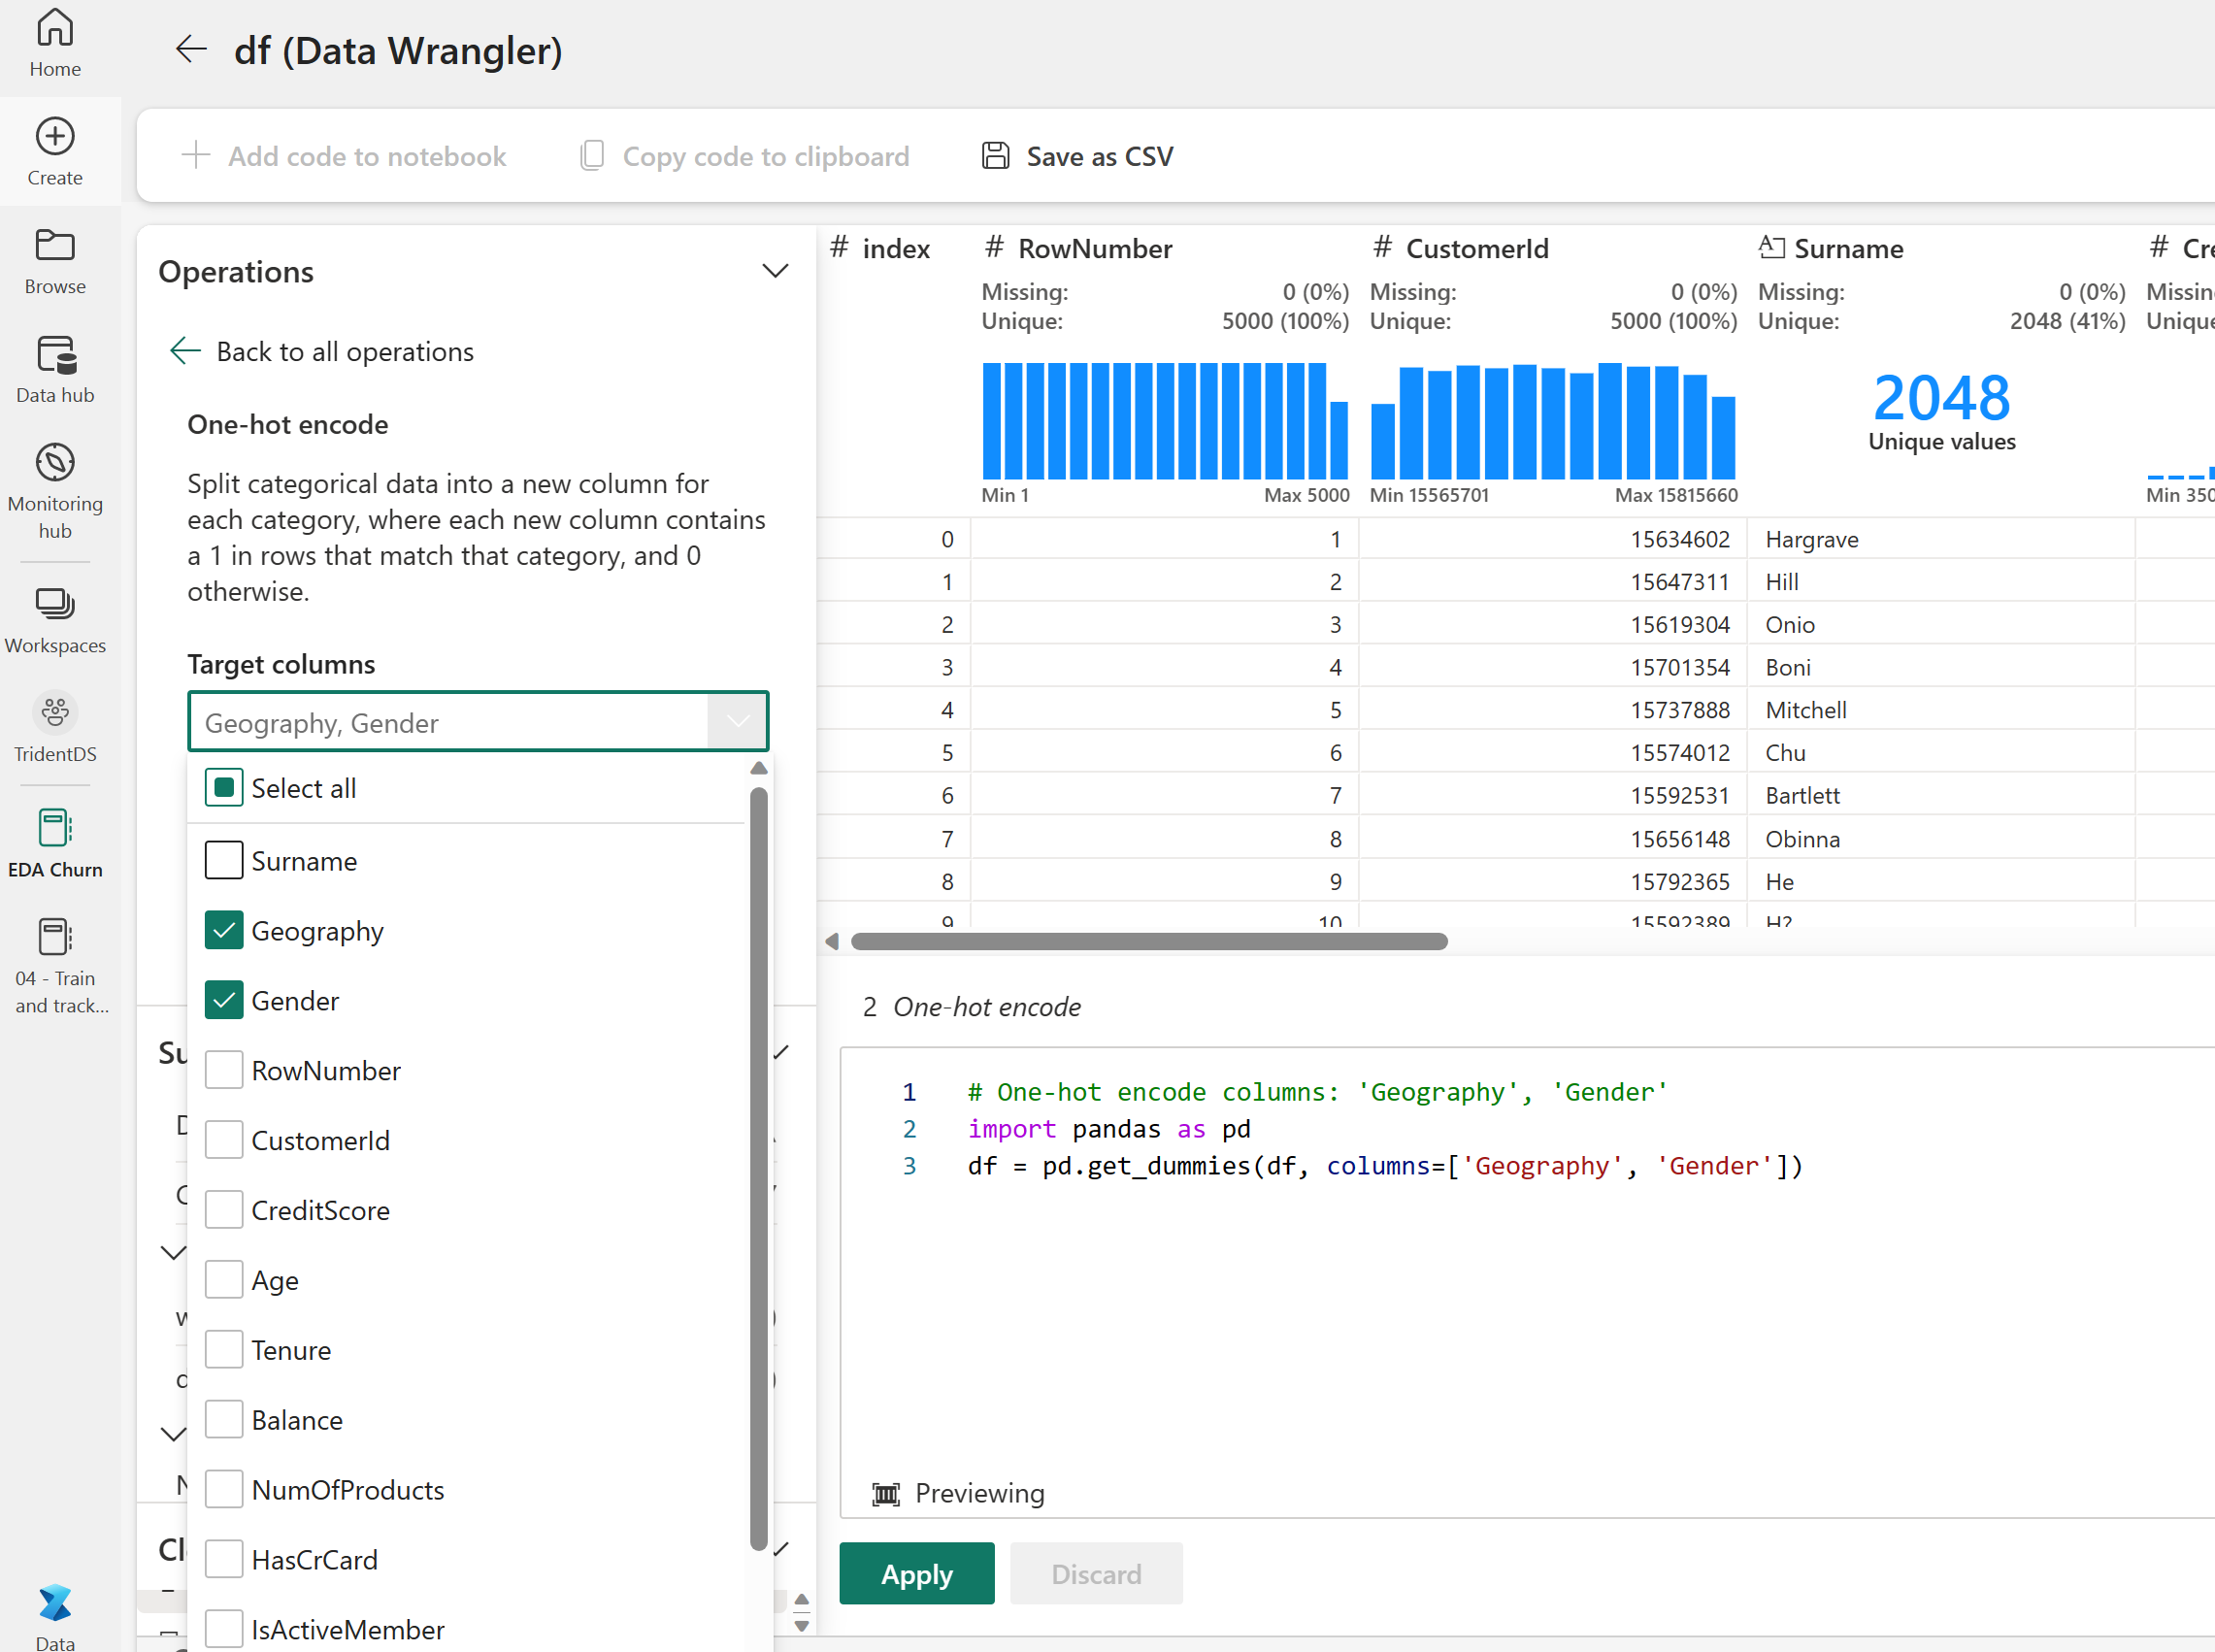
df_clean = pd.get_dummies(df_clean, columns=['Geography', 'Gender'])
建立差異資料表以產生 Power BI 報表
table_name = "df_clean"
# Create a PySpark DataFrame from pandas
sparkDF=spark.createDataFrame(df_clean)
sparkDF.write.mode("overwrite").format("delta").save(f"Tables/{table_name}")
print(f"Spark DataFrame saved to delta table: {table_name}")
探索式資料分析的觀察摘要
- 大部分客戶來自法國。 與法國和德國相比,西班牙的流失率最低。
- 大部分的客戶都擁有信用卡
- 有些客戶的年齡超過 60 歲,信用分數低於 400。 不過,它們不能被視為極端值
- 只有極少客戶擁有兩個以上的銀行產品
- 非作用中客戶流失率較高
- 性別和會員年資幾乎不會影響客戶關閉銀行賬戶的決定
步驟 4:執行模型定型和追蹤
設置資料後,現在可以定義模型。 在此筆記本中套用隨機樹系與 LightGBM 模型。
使用 scikit-learn 和 LightGBM 程式庫來實作模型,並搭配幾行程式碼。 此外,使用 MLfLow 和 Fabric 自動記錄來追蹤實驗。
此程式碼範例會從 Lakehouse 載入差異資料表。 您可以使用將 Lakehouse 用作來源的其他差異資料表。
SEED = 12345
df_clean = spark.read.format("delta").load("Tables/df_clean").toPandas()
使用 MLflow 產生追蹤和記錄模型的實驗
本節顯示如何產生實驗,並指定模型以及定型參數和評分計量。 此外,它也會示範如何定型模型、記錄模型,以及儲存定型的模型,以供日後使用。
import mlflow

# Set up the experiment name
EXPERIMENT_NAME = "sample-bank-churn-experiment"  # MLflow experiment name
由於模型已定型,自動記錄會自動擷取機器學習模型的輸入參數值和輸出計量。 此資訊接著會記錄到工作區,MLflow API 或工作區中的對應實驗可以存取並視覺化該資訊。
完成時,您的實驗會類似下圖:
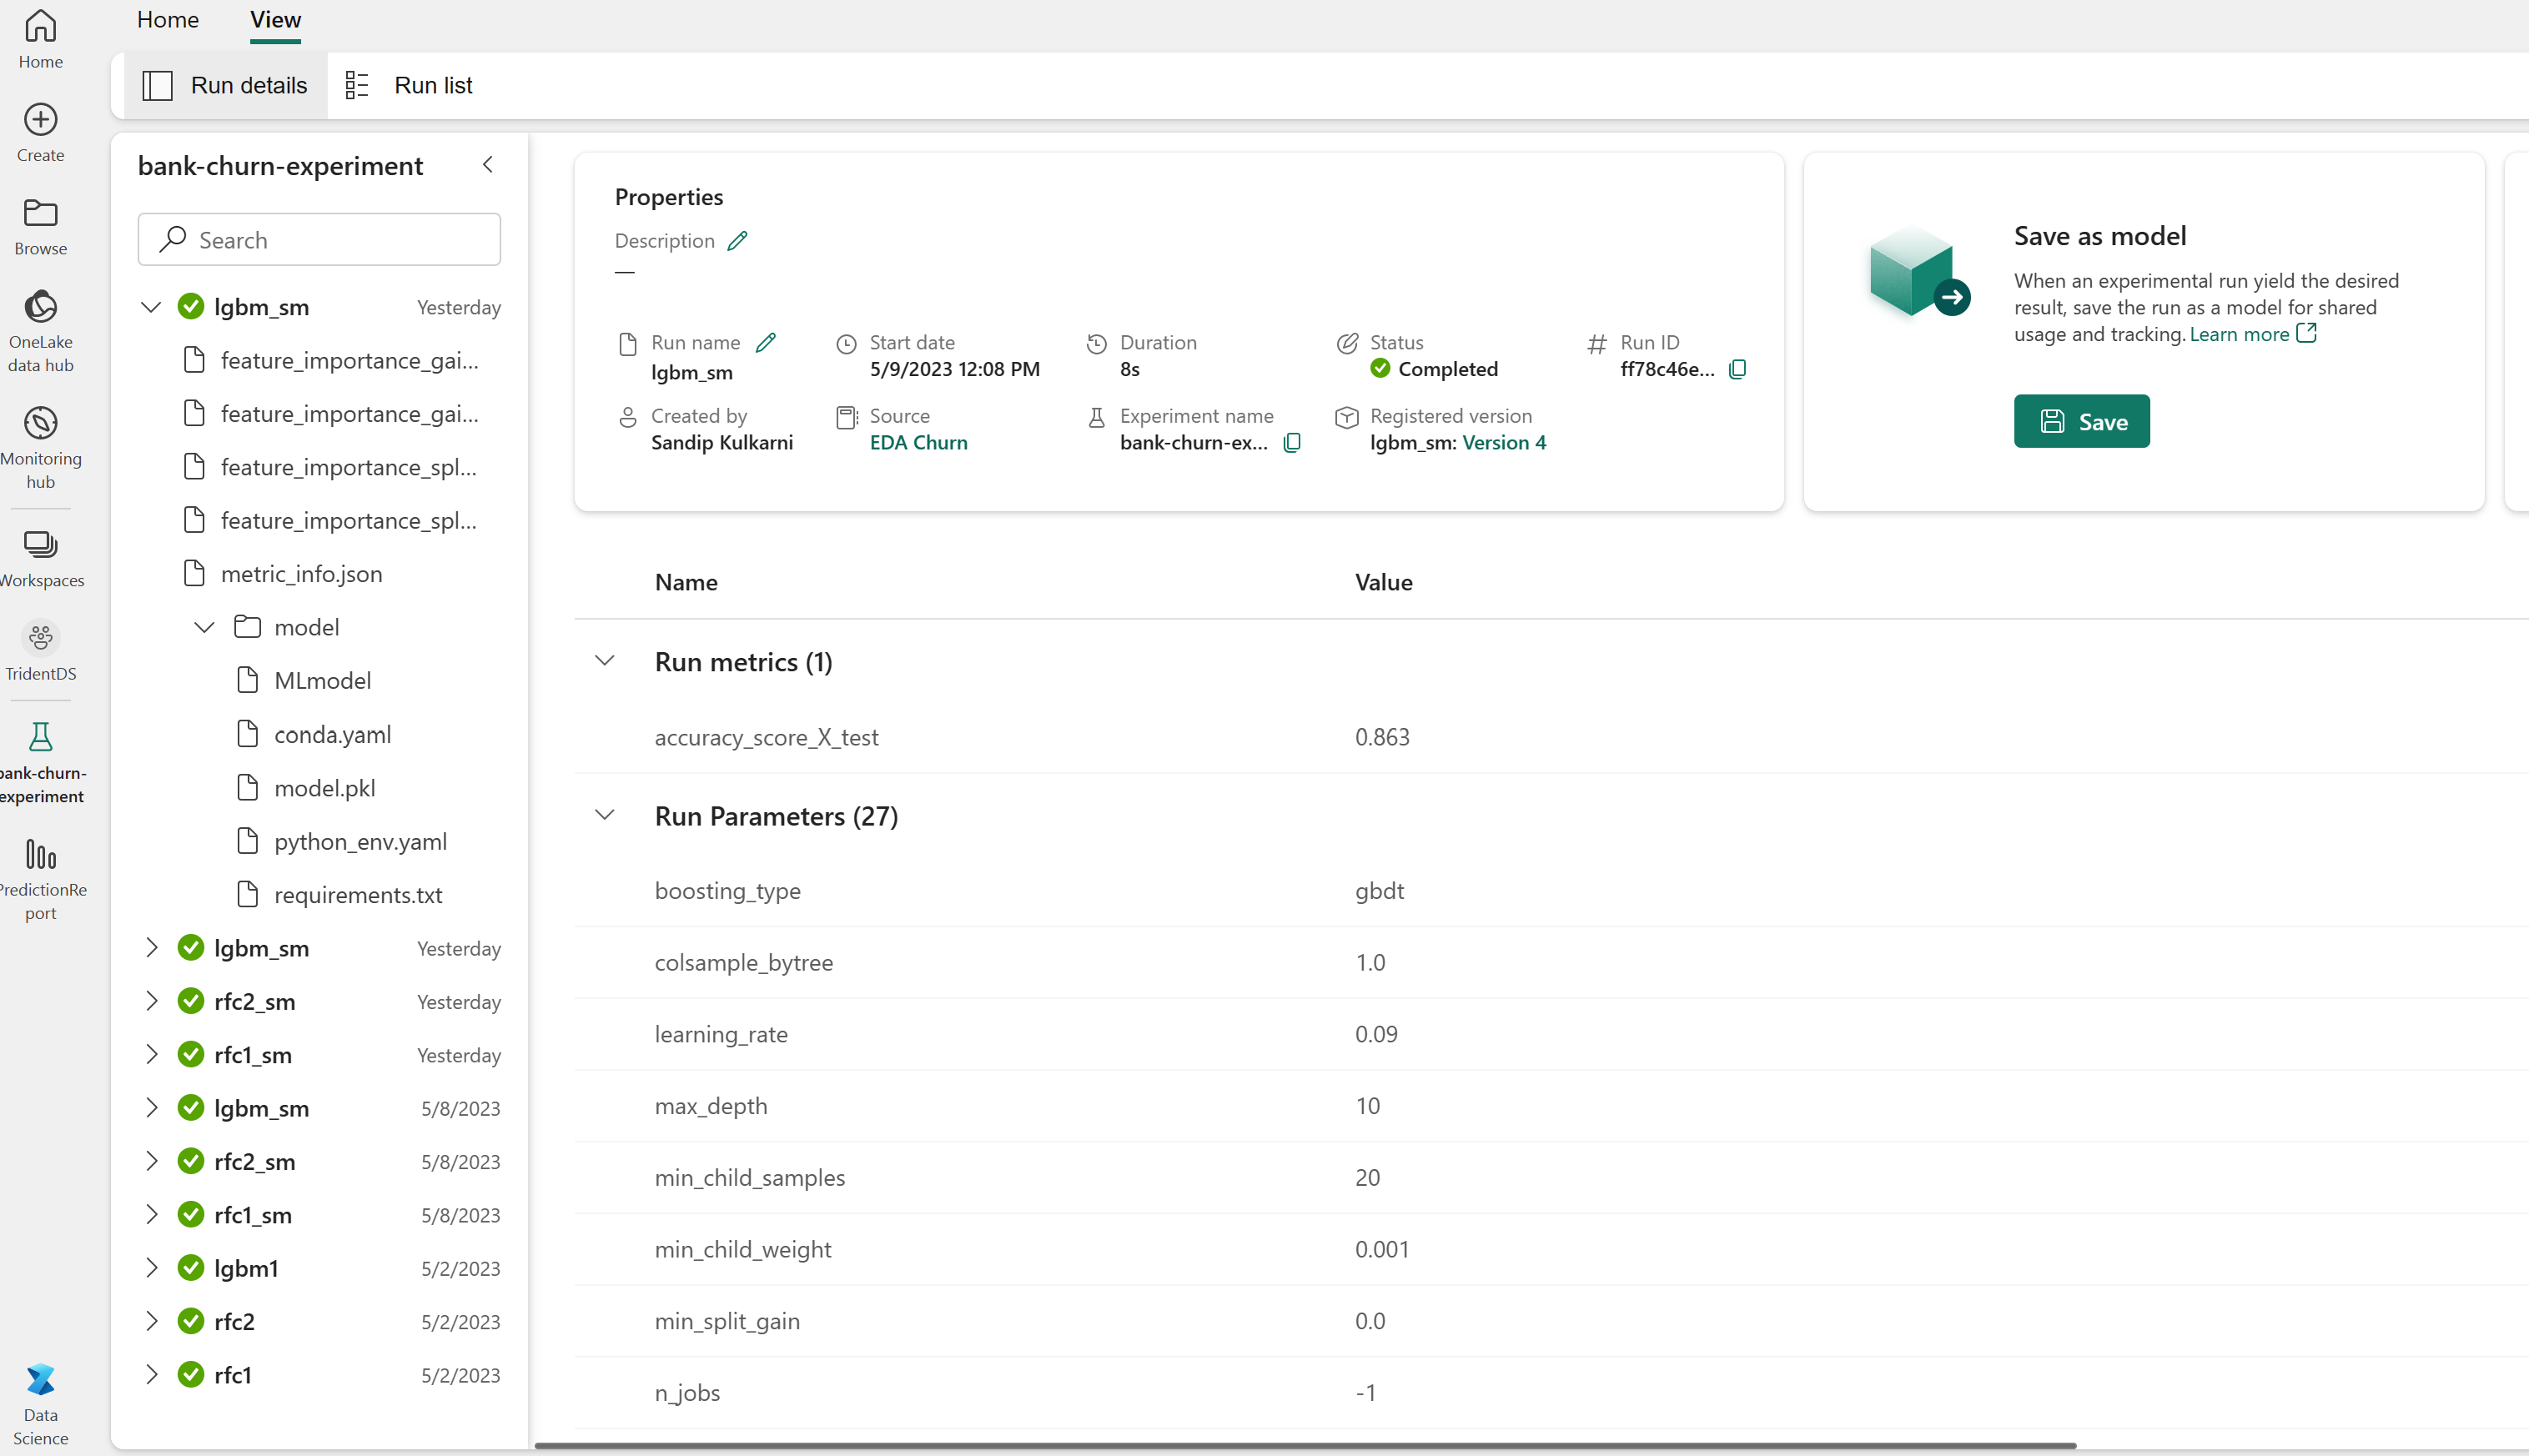
系統會記錄具有其各自名稱的所有實驗,而且您能夠追蹤其參數和效能計量。 若要深入了解自動記錄,請參閱 Microsoft Fabric 中的自動記錄。
設定實驗和自動記錄規格
mlflow.set_experiment(EXPERIMENT_NAME) # Use a date stamp to append to the experiment
mlflow.autolog(exclusive=False)
匯入 scikit-learn 和 LightGBM
# Import the required libraries for model training
from sklearn.model_selection import train_test_split
from lightgbm import LGBMClassifier
from sklearn.ensemble import RandomForestClassifier
from sklearn.metrics import accuracy_score, f1_score, precision_score, confusion_matrix, recall_score, roc_auc_score, classification_report
準備定型與測試的資料集
y = df_clean["Exited"]
X = df_clean.drop("Exited",axis=1)
# Train/test separation
X_train, X_test, y_train, y_test = train_test_split(X, y, test_size=0.20, random_state=SEED)
將 SMOTE 套用至定型資料
不平衡分類存在問題,因為少數類別的範例太少,模型無法有效地了解決策邊界。 為了處理這一點,綜合少數超取樣技術 (SMOTE) 合成少數類別新樣本最廣泛使用的方法。 使用在步驟 1 中安裝的 imblearn 程式庫來存取 SMOTE。
僅將 SMOTE 套用至定型資料集。 您必須將測試資料集保留在原始不平衡分佈中,才能取得未經處理資料之模型效能的有效近似值。 此實驗代表著生產環境中的情況。
from collections import Counter
from imblearn.over_sampling import SMOTE

sm = SMOTE(random_state=SEED)
X_res, y_res = sm.fit_resample(X_train, y_train)
new_train = pd.concat([X_res, y_res], axis=1)
如需詳細資訊,請參閱 SMOTE 和從隨機過度取樣到 SMOTE 和 ADASYN。 不平衡學習網站會裝載這些資源。
定型模型
使用隨機樹系來定型模型,最大深度為四,且具有四個特徵:
mlflow.sklearn.autolog(registered_model_name='rfc1_sm')  # Register the trained model with autologging
rfc1_sm = RandomForestClassifier(max_depth=4, max_features=4, min_samples_split=3, random_state=1) # Pass hyperparameters
with mlflow.start_run(run_name="rfc1_sm") as run:
    rfc1_sm_run_id = run.info.run_id # Capture run_id for model prediction later
    print("run_id: {}; status: {}".format(rfc1_sm_run_id, run.info.status))
    # rfc1.fit(X_train,y_train) # Imbalanced training data
    rfc1_sm.fit(X_res, y_res.ravel()) # Balanced training data
    rfc1_sm.score(X_test, y_test)
    y_pred = rfc1_sm.predict(X_test)
    cr_rfc1_sm = classification_report(y_test, y_pred)
    cm_rfc1_sm = confusion_matrix(y_test, y_pred)
    roc_auc_rfc1_sm = roc_auc_score(y_res, rfc1_sm.predict_proba(X_res)[:, 1])
使用隨機樹系來定型模型,最大深度為八,且具有六個特徵:
mlflow.sklearn.autolog(registered_model_name='rfc2_sm')  # Register the trained model with autologging
rfc2_sm = RandomForestClassifier(max_depth=8, max_features=6, min_samples_split=3, random_state=1) # Pass hyperparameters
with mlflow.start_run(run_name="rfc2_sm") as run:
    rfc2_sm_run_id = run.info.run_id # Capture run_id for model prediction later
    print("run_id: {}; status: {}".format(rfc2_sm_run_id, run.info.status))
    # rfc2.fit(X_train,y_train) # Imbalanced training data
    rfc2_sm.fit(X_res, y_res.ravel()) # Balanced training data
    rfc2_sm.score(X_test, y_test)
    y_pred = rfc2_sm.predict(X_test)
    cr_rfc2_sm = classification_report(y_test, y_pred)
    cm_rfc2_sm = confusion_matrix(y_test, y_pred)
    roc_auc_rfc2_sm = roc_auc_score(y_res, rfc2_sm.predict_proba(X_res)[:, 1])
使用 LightGBM 定型模型:
# lgbm_model
mlflow.lightgbm.autolog(registered_model_name='lgbm_sm')  # Register the trained model with autologging
lgbm_sm_model = LGBMClassifier(learning_rate = 0.07,
                        max_delta_step = 2,
                        n_estimators = 100,
                        max_depth = 10,
                        eval_metric = "logloss",
                        objective='binary',
                        random_state=42)

with mlflow.start_run(run_name="lgbm_sm") as run:
    lgbm1_sm_run_id = run.info.run_id # Capture run_id for model prediction later
    # lgbm_sm_model.fit(X_train,y_train) # Imbalanced training data
    lgbm_sm_model.fit(X_res, y_res.ravel()) # Balanced training data
    y_pred = lgbm_sm_model.predict(X_test)
    accuracy = accuracy_score(y_test, y_pred)
    cr_lgbm_sm = classification_report(y_test, y_pred)
    cm_lgbm_sm = confusion_matrix(y_test, y_pred)
    roc_auc_lgbm_sm = roc_auc_score(y_res, lgbm_sm_model.predict_proba(X_res)[:, 1])
檢視實驗成品,以追蹤模型效能
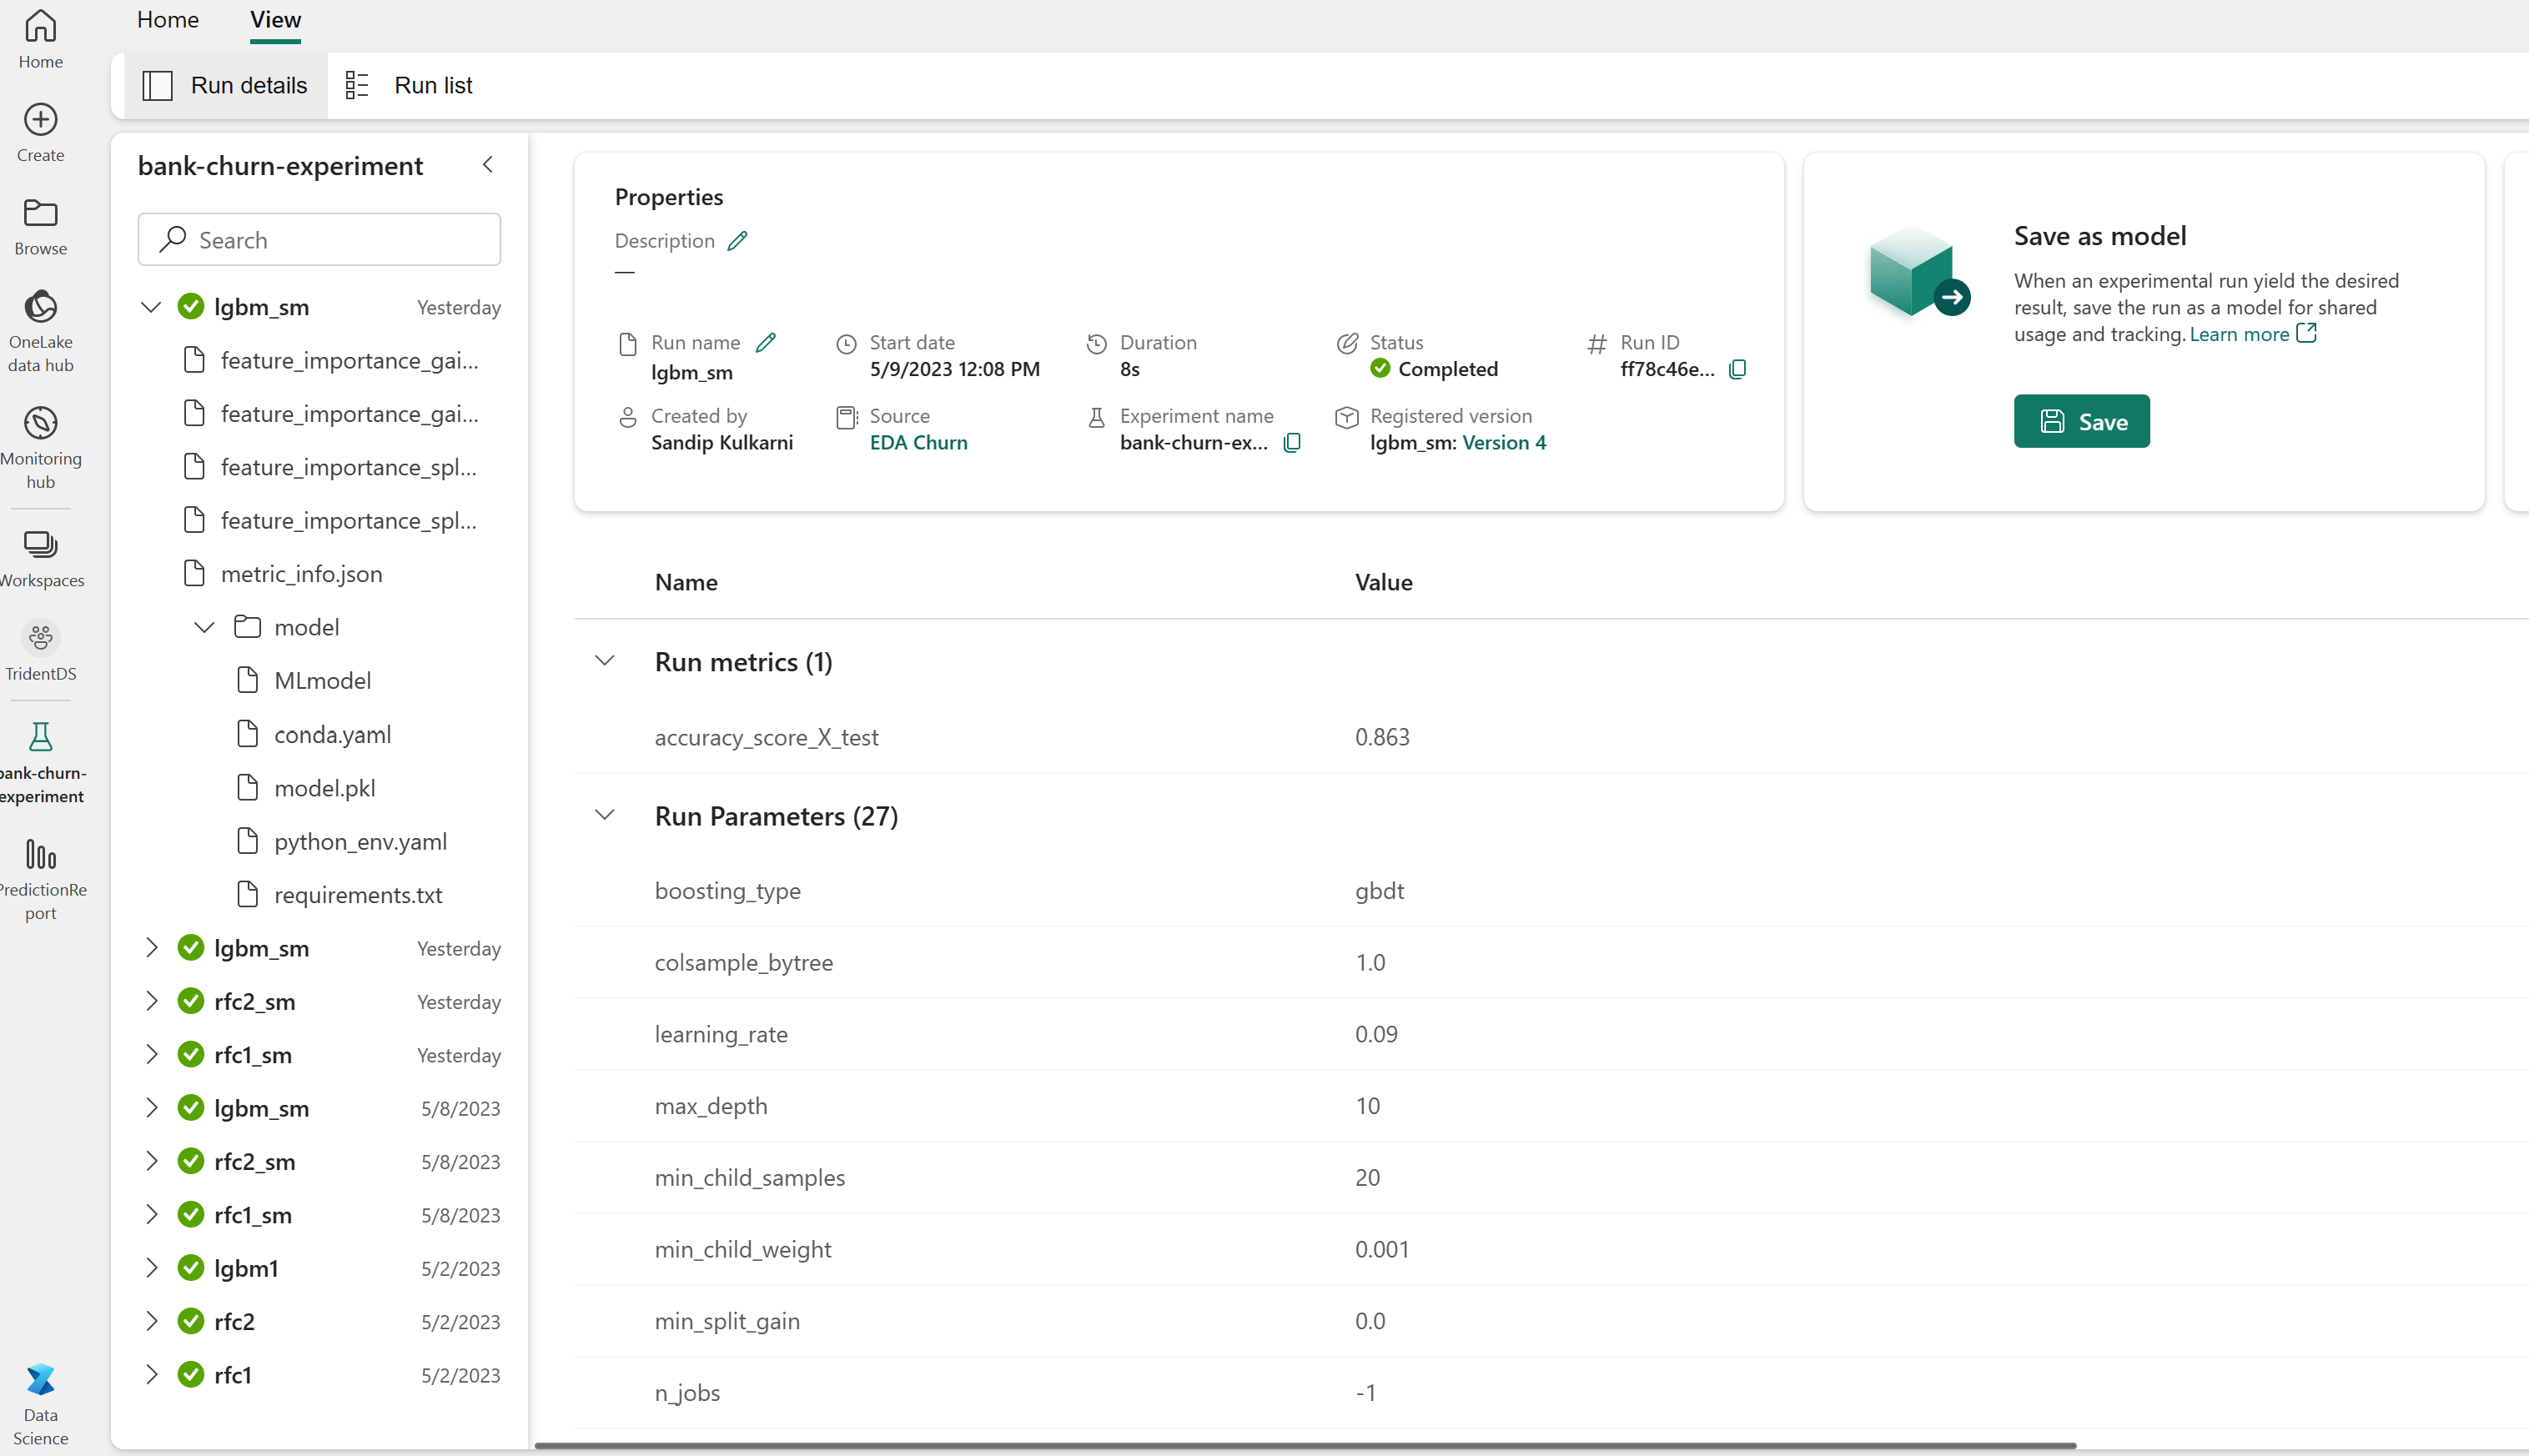
實驗執行會自動儲存在實驗成品中。 您可以在工作區中找到該成品。 成品名稱基於用來設定實驗的名稱。 所有定型的模型、其執行、效能計量與模型參數都會記錄在實驗頁面上。
要檢視您的實驗:
- 在左側面板中,選取您的工作區。
- 尋找並選取實驗名稱,在此案例中為 sample-bank-churn-experiment。
步驟 5:評估並儲存最終的機器學習模型
從工作區開啟已儲存的實驗,以便選取並儲存最佳模型:
# Define run_uri to fetch the model
# MLflow client: mlflow.model.url, list model
load_model_rfc1_sm = mlflow.sklearn.load_model(f"runs:/{rfc1_sm_run_id}/model")
load_model_rfc2_sm = mlflow.sklearn.load_model(f"runs:/{rfc2_sm_run_id}/model")
load_model_lgbm1_sm = mlflow.lightgbm.load_model(f"runs:/{lgbm1_sm_run_id}/model")
評定測試資料集上已儲存模型的效能
ypred_rfc1_sm = load_model_rfc1_sm.predict(X_test) # Random forest with maximum depth of 4 and 4 features
ypred_rfc2_sm = load_model_rfc2_sm.predict(X_test) # Random forest with maximum depth of 8 and 6 features
ypred_lgbm1_sm = load_model_lgbm1_sm.predict(X_test) # LightGBM
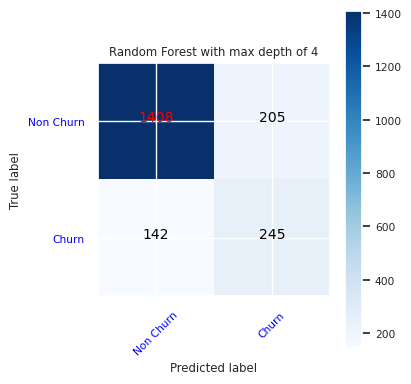
使用混淆矩陣顯示確判/誤判
若要評估分類的正確性,請建置繪製混淆矩陣的指令碼。 您也可以使用 SynapseML 工具來繪製混淆矩陣,如詐騙偵測範例中所示。
def plot_confusion_matrix(cm, classes,
                          normalize=False,
                          title='Confusion matrix',
                          cmap=plt.cm.Blues):
    print(cm)
    plt.figure(figsize=(4,4))
    plt.rcParams.update({'font.size': 10})
    plt.imshow(cm, interpolation='nearest', cmap=cmap)
    plt.title(title)
    plt.colorbar()
    tick_marks = np.arange(len(classes))
    plt.xticks(tick_marks, classes, rotation=45, color="blue")
    plt.yticks(tick_marks, classes, color="blue")

    fmt = '.2f' if normalize else 'd'
    thresh = cm.max() / 2.
    for i, j in itertools.product(range(cm.shape[0]), range(cm.shape[1])):
        plt.text(j, i, format(cm[i, j], fmt),
                 horizontalalignment="center",
                 color="red" if cm[i, j] > thresh else "black")

    plt.tight_layout()
    plt.ylabel('True label')
    plt.xlabel('Predicted label')
為隨機樹系分類器建立混淆矩陣,其中最大深度為四,具有四個特徵:
cfm = confusion_matrix(y_test, y_pred=ypred_rfc1_sm)
plot_confusion_matrix(cfm, classes=['Non Churn','Churn'],
                      title='Random Forest with max depth of 4')
tn, fp, fn, tp = cfm.ravel()
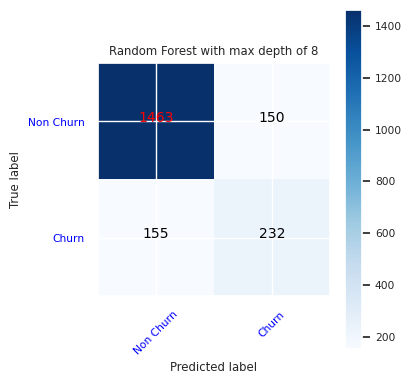
為隨機樹系分類器建立混淆矩陣,其中最大深度為八,具有六個特徵:
cfm = confusion_matrix(y_test, y_pred=ypred_rfc2_sm)
plot_confusion_matrix(cfm, classes=['Non Churn','Churn'],
                      title='Random Forest with max depth of 8')
tn, fp, fn, tp = cfm.ravel()
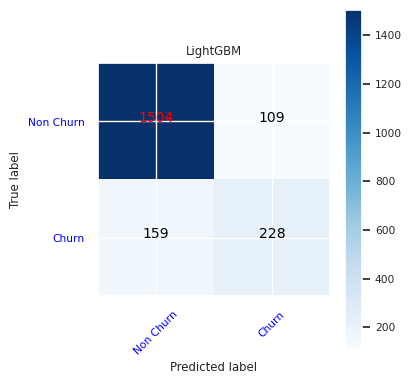
建立 LightGBM 的混淆矩陣:
cfm = confusion_matrix(y_test, y_pred=ypred_lgbm1_sm)
plot_confusion_matrix(cfm, classes=['Non Churn','Churn'],
                      title='LightGBM')
tn, fp, fn, tp = cfm.ravel()
儲存 Power BI 的結果
將差異畫面儲存至 Lakehouse,將模型預測結果移至 Power BI 視覺效果。
df_pred = X_test.copy()
df_pred['y_test'] = y_test
df_pred['ypred_rfc1_sm'] = ypred_rfc1_sm
df_pred['ypred_rfc2_sm'] =ypred_rfc2_sm
df_pred['ypred_lgbm1_sm'] = ypred_lgbm1_sm
table_name = "df_pred_results"
sparkDF=spark.createDataFrame(df_pred)
sparkDF.write.mode("overwrite").format("delta").option("overwriteSchema", "true").save(f"Tables/{table_name}")
print(f"Spark DataFrame saved to delta table: {table_name}")
步驟 6:存取 Power BI 中的視覺效果
在 Power BI 中存取已儲存的資料表:
- 在左側,選取 OneLake 資料中樞
- 選取您新增至此筆記本的 Lakehouse
- 在 [開啟此 Lakehouse] 區段中,選取 [開啟]
- 在功能區上,選取 [新增語意模型]。 選取
df_pred_results,然後選取 [繼續],以建立連結至預測的新 Power BI 語意模型 - 從語意模型頁面頂端的工具選取 [新增報表],以開啟 Power BI 報表撰寫頁面
下列螢幕擷取畫面顯示一些範例視覺效果。 資料面板會顯示要從資料表選取的差異資料表和資料行。 選取適當的類別 (x) 軸和值 (y) 軸之後,您可以選擇篩選條件和函式,例如資料表資料行的總和或平均值。
注意
在此螢幕擷取畫面中,說明範例描述 Power BI 中已儲存預測結果的分析:

不過,針對客戶流失的實際使用案例,平台使用者可能需要更徹底的視覺效果構想,以根據主題專業知識,以及組織和商務分析團隊和公司已標準化為計量的內容來建立視覺效果。
Power BI 報表顯示使用兩個以上銀行產品的客戶流失率較高。 不過,很少有客戶擁有兩個以上的產品。 (請參閱左下方面板中的繪圖。) 銀行應收集更多資料,但也應會調查與其他產品相互關聯的其他功能。
德國的銀行客戶與法國和西班牙的客戶相比,流失率較高。 (請參閱右下方面板中的繪圖)。 對鼓勵客戶離開的因素進行調查可能會有所幫助。
有更多的中年客戶 (25 至 45 歲)。 45 到 60 之間的客戶更多地傾向於離開。
最後,信用分數較低的客戶很可能離開銀行,轉投其他金融機構。 該銀行應探索鼓勵信用分數較低和帳戶餘額較低的客戶留在銀行的方式。
# Determine the entire runtime
print(f"Full run cost {int(time.time() - ts)} seconds.")