Monitor usage
Azure DevOps Services
Monitoring usage in Azure DevOps Services is crucial for identifying and addressing performance bottlenecks. By understanding the common commands and operations that trigger usage messages, you can optimize your tools and processes to ensure efficient use of resources. Regularly reviewing the usage page and audit logs helps maintain the performance and reliability of your Azure DevOps environment.
Prerequisites
Permissions: Member of the Project Collection Administrators group. Organization owners are automatically members of this group.
Note
To view usage from an audit perspective, see Access, export, and filter audit logs. This view doesn't include TSTUs but retains data for 90 days.
For more information, see Rate and usage limits.
View usage
Sign in to your organization (
https://dev.azure.com/{Your_Organization}).Select
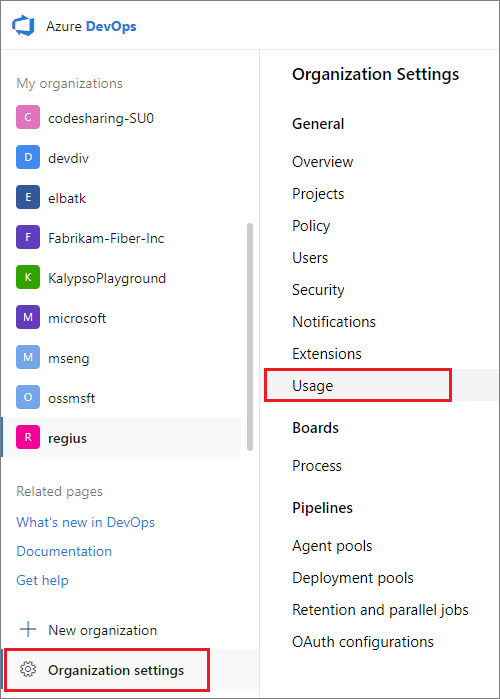
 Organization settings > Usage.

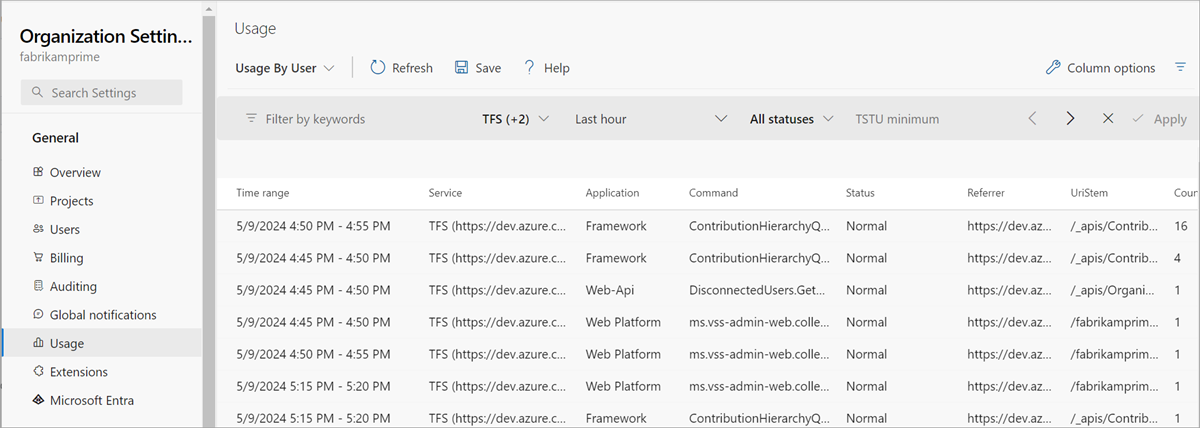
- Use this page to investigate the usage of other users. Usage can occur from regular web portal operations or the use of command line or REST API tools.
a. View by the following categories: - Usage by user - Usage by pipeline - Top user agents - Top commands - Top build pipelines - Top release pipelines
b. Filter by the following column options: - User - User agent - IP address - Time range - Service - Application - Referrer - Command - UriStem - Status - Count - Usage (TSTUs) - Delay (s)
Azure DevOps displays the last hour of requests by default. You can select from other increments of time.
c. Select from the following statuses: - All statuses - Normal - Delayed - Blocked
d. The usage page is scoped to the 30 minutes before and after the first delayed request. Review the request history leading up to delayed requests.

Understand notifications and alerts
- When a user's request gets delayed, they receive a notification email and see a warning banner on the web. Both the banner and email link to the usage page.
- When a user doesn't have an email address, the notification gets sent to the Project Collection Administrators group members.
Identify high usage
- Commands consuming a high number of Azure DevOps throughput units (TSTUs) can cause users to exceed thresholds.
- The User Agent and IP address columns help identify the source of these commands. Custom tools or build service accounts might be making numerous calls in a short time window.
Optimize tools and processes
To avoid issues, consider rewriting tools or updating build processes to reduce the type and number of calls. For example, instead of pulling a large version control repository from scratch regularly, pull incrementally.
Understand usage page details
- Request history on the
Usagepage is in descending order by default. - Usage gets grouped by command into five-minute time windows.
- The
Countcolumn shows the number of commands in the window. - Other columns highlight total TSTUs and delay time.