Perform data analysis using Microsoft Fabric Notebooks
Applies to: ✅ SQL database in Microsoft Fabric
You can perform analysis on your data using many tools, such as the Power BI report you created in the last step of this tutorial. Another popular tool for analysis is Jupyter Notebooks. Notebooks are a Python-based item that contains cells that hold either code or plain text (as Markdown, a rich text formatting language for plain text). The code that runs is based on the Kernel, or environment, of the Jupyter Notebook. Microsoft Fabric contains Notebooks and multiple environments for the code cells.
In our sample tutorial, your organization has asked that you set up a Notebook for the data in your SQL data. We'll use the SQL analytics endpoint of your SQL database, which contains automatically replicated data from your SQL database.
Prerequisites
- Complete all the previous steps in this tutorial.
Data analysis with T-SQL notebooks
Navigate to the Workspace you created for this tutorial from the Home of your Microsoft Fabric portal.
Select the New Item button in the tool bar, and then select All items and scroll until you see a Notebook item. Select that item to create a new Notebook.
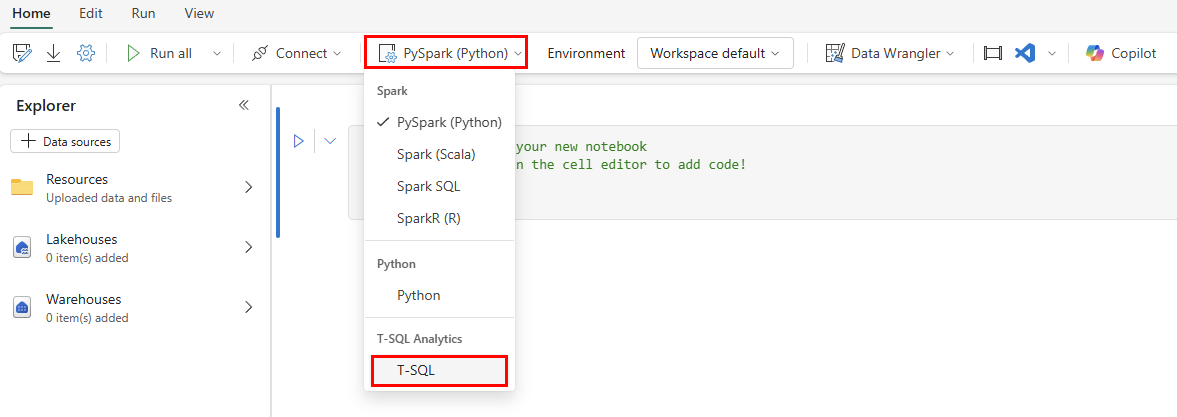
In the icon bar, change the environment from PySpark (Python) to T-SQL.
In each code cell, there is a drop-down list for the code language. In the first cell in the Notebook, change the code language from PySpark (Python) to T-SQL.
In the Notebook Explorer, select the Warehouses item.
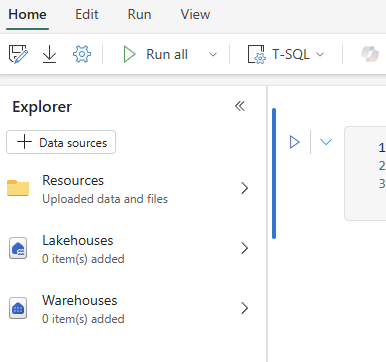
Select the + Warehouses button.
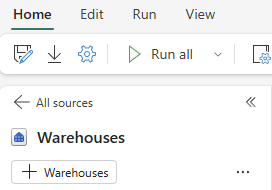
Select the SQL analytics endpoint object that is named
supply_chain_analytics_database, with the same name of the object you created earlier in this tutorial. Select Confirm.Expand the database, expand Schemas. Expand the
SupplyChainschema. Expand Views, and locate the SQL view namedvProductsBySupplier.Select the ellipses next to that view. and select the option that says
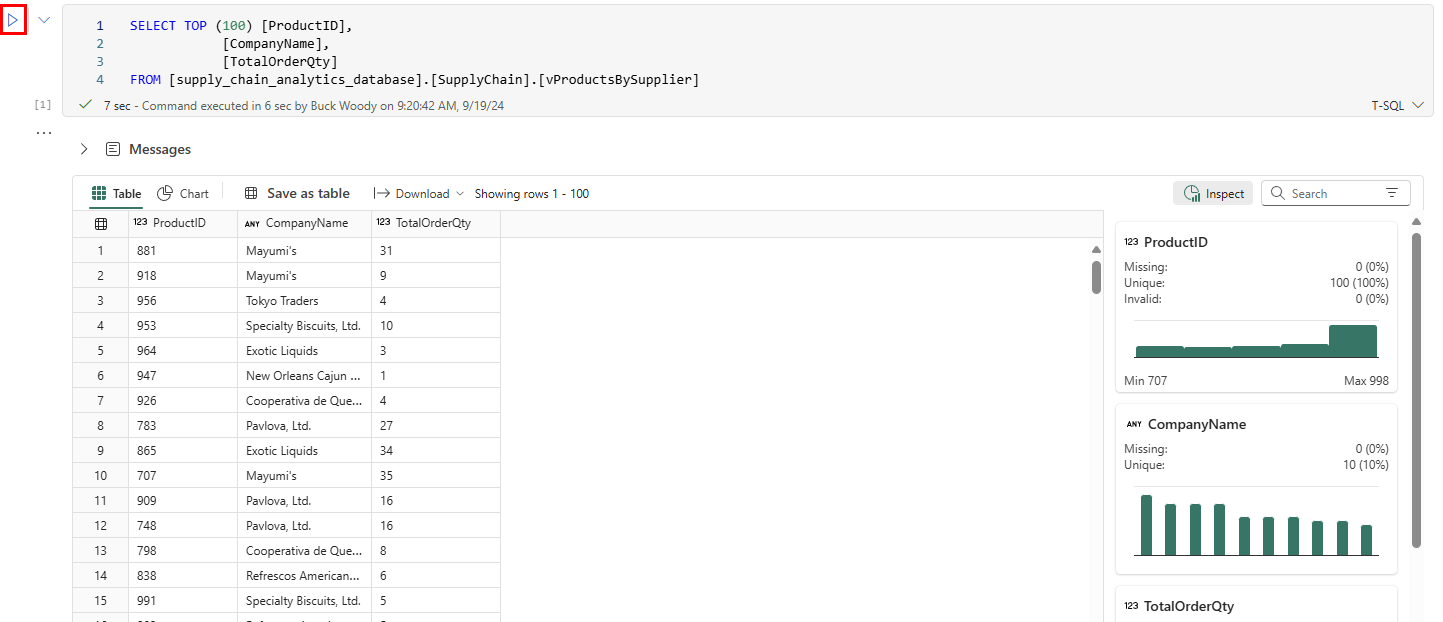
SELECT TOP 100.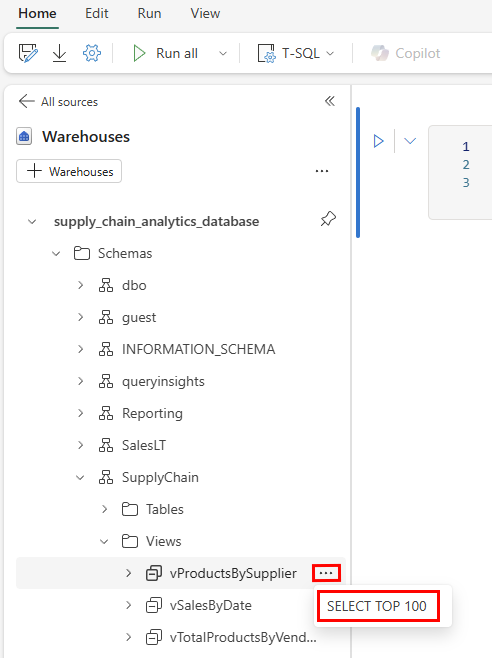
This creates a cell with T-SQL code that has the statements pre-populated for you. Select the Run Cell button for the cell to run the query and return the results.
In the results, you can see not only the data requested, but buttons that allow you to view charts, save the data as another table, download, and more. To the side of the results you can see a new pane with quick inspection of the data elements, showing minimum and maximum values, missing data, and unique counts of the data returned.
Hovering between the code cells shows you a menu to add another cell. Select the + Markdown button.
This places a text-based field where you can add information. Styling for the text is available in the icon bar, or you can select the
</>button to work with Markdown directly. The result of the formatting show as a preview of the formatted text.Select the Save As icon in the ribbon. Enter the text
products_by_suppliers_notebook. Ensure you set the location to your tutorial Workspace. Select the Save button to save the notebook.
