Training
Learning path
AZ-204: Troubleshoot solutions by using Application Insights - Training
Learn how to instrument apps to enable Application Insights to monitor performance and help troubleshoot issues.
This browser is no longer supported.
Upgrade to Microsoft Edge to take advantage of the latest features, security updates, and technical support.
If you enabled Application Insights Snapshot Debugger for your application, but aren't seeing snapshots for exceptions, you can use these instructions to troubleshoot.
There can be many different reasons why snapshots aren't generated. You can start by running the snapshot health check to identify some of the possible common causes.
Below you can find scenarios where Snapshot Collector isn't supported:
| Scenario | Side effects | Recommendation |
|---|---|---|
| When you use the Snapshot Collector SDK in your application directly (.csproj) and you have enabled the advance option "Interop". | The local Application Insights SDK (including Snapshot Collector telemetry) will be lost; therefore, no snapshots will be available. Your application could crash at startup with System.ArgumentException: telemetryProcessorTypedoes not implement ITelemetryProcessor For more information about the Application Insights feature "Interop", see the Application monitoring for Azure App Service and ASP.NET Core. |
If you're using the advance option "Interop", use the codeless Snapshot Collector injection (enabled through the Azure portal UX). |
Currently the only regions that require endpoint modifications are Azure Government and Azure China.
For App Service and applications using the Application Insights SDK, you have to update the connection string using the supported overrides for Snapshot Debugger as defined below:
| Connection string property | US Government Cloud | China Cloud |
|---|---|---|
| SnapshotEndpoint | https://snapshot.monitor.azure.us |
https://snapshot.monitor.azure.cn |
For more information about other connection overrides, see Application Insights documentation.
For Function App, you have to update the host.json using the supported overrides below:
| Property | US Government Cloud | China Cloud |
|---|---|---|
| AgentEndpoint | https://snapshot.monitor.azure.us |
https://snapshot.monitor.azure.cn |
Here is an example of the host.json updated with the US Government Cloud agent endpoint:
{
  "version": "2.0",
  "logging": {
    "applicationInsights": {
      "samplingExcludedTypes": "Request",
      "samplingSettings": {
        "isEnabled": true
      },
      "snapshotConfiguration": {
        "isEnabled": true,
        "agentEndpoint": "https://snapshot.monitor.azure.us"
      }
    }
  }
}
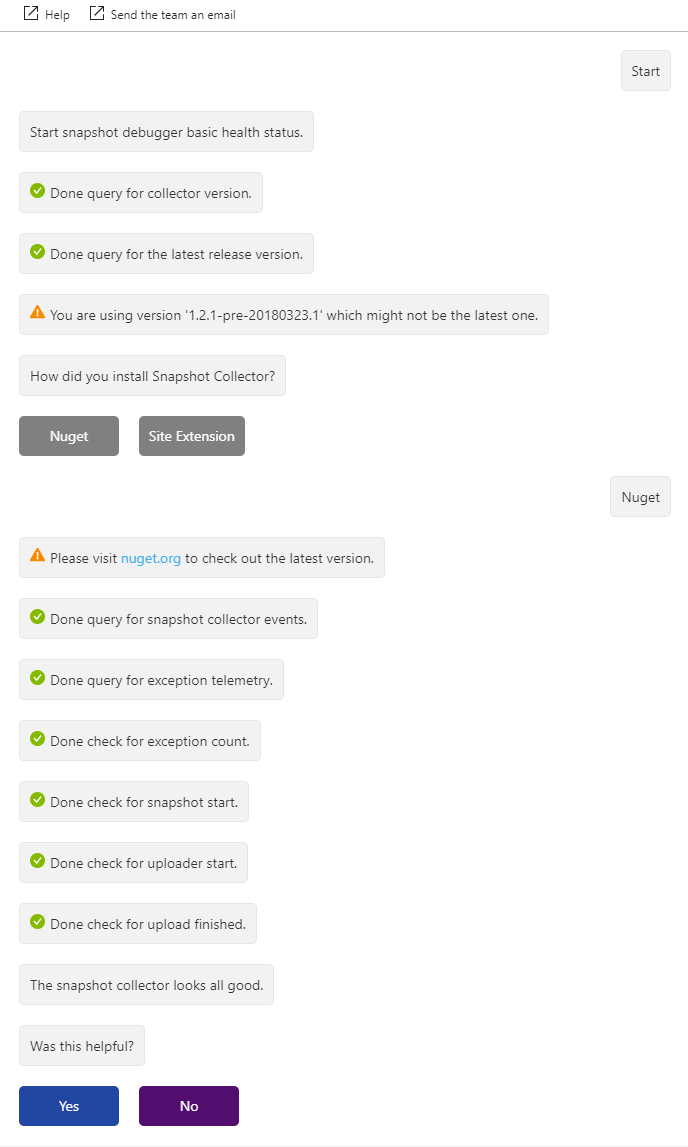
Several common problems result in the Open Debug Snapshot not showing up. For example, an outdated Snapshot Collector is used; the daily upload limit is reached; or perhaps the snapshot is just taking a long time to upload. Use the Snapshot Health Check to troubleshoot common problems.
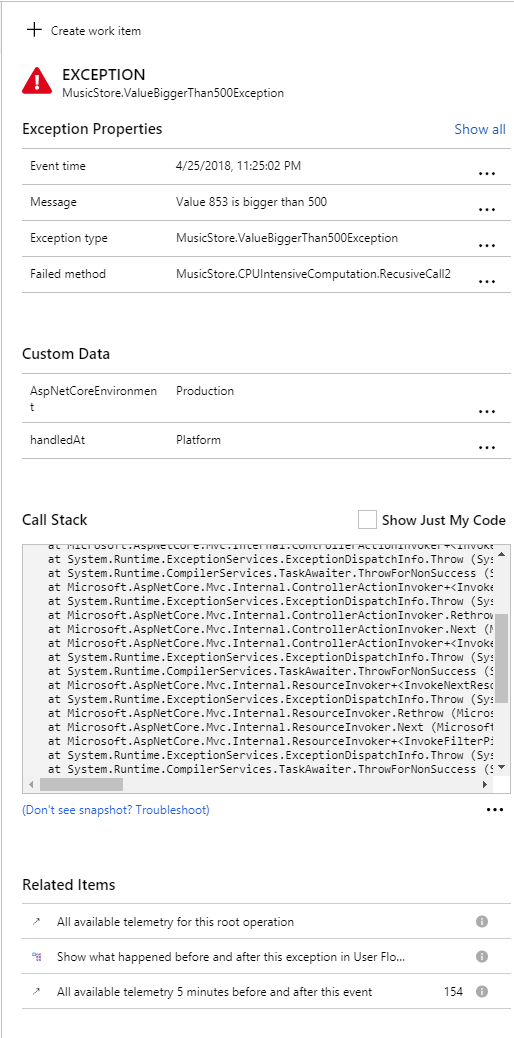
There's a link in the exception pane of the end-to-end trace view that takes you to the Snapshot Health Check.

The interactive, chat-like interface looks for common problems and guides you to fix them.

If that doesn't solve the problem, then refer to the following manual troubleshooting steps.
Make sure you're using the correct instrumentation key in your published application. Usually, the instrumentation key is read from the ApplicationInsights.config file. Verify the value is the same as the instrumentation key for the Application Insights resource that you see in the portal.
On March 31, 2025, support for instrumentation key ingestion will end. Instrumentation key ingestion will continue to work, but we'll no longer provide updates or support for the feature. Transition to connection strings to take advantage of new capabilities.
If you have an ASP.NET application that's hosted in Azure App Service or in IIS on a virtual machine, your application could fail to connect to the Snapshot Debugger service due to a missing SSL security protocol.
The Snapshot Debugger endpoint requires TLS version 1.2. The set of SSL security protocols is one of the quirks enabled by the httpRuntime targetFramework value in the system.web section of web.config.
If the httpRuntime targetFramework is 4.5.2 or lower, then TLS 1.2 isn't included by default.
Note
The httpRuntime targetFramework value is independent of the target framework used when building your application.
To check the setting, open your web.config file and find the system.web section. Ensure that the targetFramework for httpRuntime is set to 4.6 or above.
<system.web>
   ...
   <httpRuntime targetFramework="4.7.2" />
   ...
</system.web>
Note
Modifying the httpRuntime targetFramework value changes the runtime quirks applied to your application and can cause other, subtle behavior changes. Be sure to test your application thoroughly after making this change. For a full list of compatibility changes, see Re-targeting changes.
Note
If the targetFramework is 4.7 or a later version, Windows determines the available protocols. In Azure App Service, TLS 1.2 is available. However, if you're using your own virtual machine, you may need to enable TLS 1.2 in the OS.
If you're using a preview version of .NET Core or your application references Application Insights SDK, directly or indirectly via a dependent assembly, follow the instructions for Enable Snapshot Debugger for other environments.
If Snapshot Debugger was enabled through the Application Insights pane in the portal, it was enabled by the Diagnostic Services site extension.
Note
Codeless installation of Application Insights Snapshot Debugger follows the .NET Core support policy. For more information about supported runtimes, see .NET Core Support Policy.
You can check the Status Page of this extension by going to the following URL:
https://{site-name}.scm.azurewebsites.net/DiagnosticServices
Note
The domain of the Status Page link will vary depending on the cloud. This domain will be the same as the Kudu management site for App Service.
This Status Page shows the installation state of the Profiler and Snapshot Collector agents. If there was an unexpected error, it will be displayed and show how to fix it.
You can use the Kudu management site for App Service to get the base URL of this Status Page:
/DiagnosticServices and press Enter.
It will end like this: https://<kudu-url>/DiagnosticServices.Based on how Snapshot Debugger was enabled, see the following options:
If Snapshot Debugger was enabled through the Application Insights pane in the portal, then your application should already be running the latest NuGet package.
If Snapshot Debugger was enabled by including the Microsoft.ApplicationInsights.SnapshotCollector NuGet package, use Visual Studio's NuGet Package Manager to make sure you're using the latest version of Microsoft.ApplicationInsights.SnapshotCollector.
For the latest updates and bug fixes, consult the release notes.
After a snapshot is created, a minidump file (.dmp) is created on disk. A separate uploader process creates that minidump file and uploads it, along with any associated PDBs, to Application Insights Snapshot Debugger storage. After the minidump has uploaded successfully, it's deleted from disk. The log files for the uploader process are kept on disk. In an App Service environment, you can find these logs in D:\Home\LogFiles. Use the Kudu management site for App Service to find these log files.
You should see at least one file with a name that begins with Uploader_ or SnapshotUploader_ and a .log extension. Select the appropriate icon to download any log files or open them in a browser.
The file name includes a unique suffix that identifies the App Service instance. If your App Service instance is hosted on more than one machine, there are separate log files for each machine. When the uploader detects a new minidump file, it's recorded in the log file. Here's an example of a successful snapshot and upload:
SnapshotUploader.exe Information: 0 : Received Fork request ID 139e411a23934dc0b9ea08a626db16c5 from process 6368 (Low pri)
    DateTime=2018-03-09T01:42:41.8571711Z
SnapshotUploader.exe Information: 0 : Creating minidump from Fork request ID 139e411a23934dc0b9ea08a626db16c5 from process 6368 (Low pri)
    DateTime=2018-03-09T01:42:41.8571711Z
SnapshotUploader.exe Information: 0 : Dump placeholder file created: 139e411a23934dc0b9ea08a626db16c5.dm_
    DateTime=2018-03-09T01:42:41.8728496Z
SnapshotUploader.exe Information: 0 : Dump available 139e411a23934dc0b9ea08a626db16c5.dmp
    DateTime=2018-03-09T01:42:45.7525022Z
SnapshotUploader.exe Information: 0 : Successfully wrote minidump to D:\local\Temp\Dumps\c12a605e73c44346a984e00000000000\139e411a23934dc0b9ea08a626db16c5.dmp
    DateTime=2018-03-09T01:42:45.7681360Z
SnapshotUploader.exe Information: 0 : Uploading D:\local\Temp\Dumps\c12a605e73c44346a984e00000000000\139e411a23934dc0b9ea08a626db16c5.dmp, 214.42 MB (uncompressed)
    DateTime=2018-03-09T01:42:45.7681360Z
SnapshotUploader.exe Information: 0 : Upload successful. Compressed size 86.56 MB
    DateTime=2018-03-09T01:42:59.6184651Z
SnapshotUploader.exe Information: 0 : Extracting PDB info from D:\local\Temp\Dumps\c12a605e73c44346a984e00000000000\139e411a23934dc0b9ea08a626db16c5.dmp.
    DateTime=2018-03-09T01:42:59.6184651Z
SnapshotUploader.exe Information: 0 : Matched 2 PDB(s) with local files.
    DateTime=2018-03-09T01:42:59.6809606Z
SnapshotUploader.exe Information: 0 : Stamp does not want any of our matched PDBs.
    DateTime=2018-03-09T01:42:59.8059929Z
SnapshotUploader.exe Information: 0 : Deleted D:\local\Temp\Dumps\c12a605e73c44346a984e00000000000\139e411a23934dc0b9ea08a626db16c5.dmp
    DateTime=2018-03-09T01:42:59.8530649Z
Note
The example above is from version 1.2.0 of the Microsoft.ApplicationInsights.SnapshotCollector NuGet package. In earlier versions, the uploader process is called MinidumpUploader.exe and the log is less detailed.
In the previous example, the instrumentation key is c12a605e73c44346a984e00000000000. This value should match the instrumentation key for your application.
The minidump is associated with a snapshot with the ID 139e411a23934dc0b9ea08a626db16c5. You can use this ID later to locate the associated exception record in Application Insights Analytics.
The uploader scans for new PDBs about once every 15 minutes. Here's an example:
SnapshotUploader.exe Information: 0 : PDB rescan requested.
    DateTime=2018-03-09T01:47:19.4457768Z
SnapshotUploader.exe Information: 0 : Scanning D:\home\site\wwwroot for local PDBs.
    DateTime=2018-03-09T01:47:19.4457768Z
SnapshotUploader.exe Information: 0 : Local PDB scan complete. Found 2 PDB(s).
    DateTime=2018-03-09T01:47:19.4614027Z
SnapshotUploader.exe Information: 0 : Deleted PDB scan marker : D:\local\Temp\Dumps\c12a605e73c44346a984e00000000000\6368.pdbscan
    DateTime=2018-03-09T01:47:19.4614027Z
For applications that aren't hosted in App Service, the uploader logs are in the same folder as the minidumps: %TEMP%\Dumps\<ikey> (where <ikey> is your instrumentation key).
In Cloud Services, the default temporary folder could be too small to hold the minidump files, leading to lost snapshots.
The space needed depends on the total working set of your application and the number of concurrent snapshots.
The working set of a 32-bit ASP.NET web role is typically between 200 MB and 500 MB. Allow for at least two concurrent snapshots.
For example, if your application uses 1 GB of total working set, you should make sure there is at least 2 GB of disk space to store snapshots.
Follow these steps to configure your Cloud Service role with a dedicated local resource for snapshots.
Add a new local resource to your Cloud Service by editing the Cloud Service definition (.csdef) file. The following example defines a resource called SnapshotStore with a size of 5 GB.
<LocalResources>
  <LocalStorage name="SnapshotStore" cleanOnRoleRecycle="false" sizeInMB="5120" />
</LocalResources>
Modify your role's startup code to add an environment variable that points to the SnapshotStore local resource. For Worker Roles, the code should be added to your role's OnStart method:
public override bool OnStart()
{
    Environment.SetEnvironmentVariable("SNAPSHOTSTORE", RoleEnvironment.GetLocalResource("SnapshotStore").RootPath);
    return base.OnStart();
}
For Web Roles (ASP.NET), the code should be added to your web application's Application_Start method:
using Microsoft.WindowsAzure.ServiceRuntime;
using System;

namespace MyWebRoleApp
{
    public class MyMvcApplication : System.Web.HttpApplication
    {
       protected void Application_Start()
       {
          Environment.SetEnvironmentVariable("SNAPSHOTSTORE", RoleEnvironment.GetLocalResource("SnapshotStore").RootPath);
          // TODO: The rest of your application startup code
       }
    }
}
Update the ApplicationInsights.config file of your role to override the temporary folder location used by SnapshotCollector.
<TelemetryProcessors>
 <Add Type="Microsoft.ApplicationInsights.SnapshotCollector.SnapshotCollectorTelemetryProcessor, Microsoft.ApplicationInsights.SnapshotCollector">
   <!-- Use the SnapshotStore local resource for snapshots -->
   <TempFolder>%SNAPSHOTSTORE%</TempFolder>
   <!-- Other SnapshotCollector configuration options -->
 </Add>
</TelemetryProcessors>
When the Snapshot Collector starts up, it tries to find a folder on disk that is suitable for running the Snapshot Uploader process. The chosen folder is known as the Shadow Copy folder.
The Snapshot Collector checks a few well-known locations, making sure it has permissions to copy the Snapshot Uploader binaries. The following environment variables are used:
Fabric_Folder_App_TempLOCALAPPDATAAPPDATATEMPIf a suitable folder can't be found, Snapshot Collector reports an error saying "Couldn't find a suitable shadow copy folder."
If the copy fails, Snapshot Collector reports a ShadowCopyFailed error.
If the uploader can't be launched, Snapshot Collector reports an UploaderCannotStartFromShadowCopy error. The body of the message often contains System.UnauthorizedAccessException. This error usually occurs because the application is running under an account with reduced permissions. The account has permission to write to the shadow copy folder, but it doesn't have permission to execute code.
Since these errors usually happen during startup, they'll usually be followed by an ExceptionDuringConnect error saying "Uploader failed to start."
To work around these errors, you can specify the shadow copy folder manually via the ShadowCopyFolder configuration option. For example, using ApplicationInsights.config:
<TelemetryProcessors>
 <Add Type="Microsoft.ApplicationInsights.SnapshotCollector.SnapshotCollectorTelemetryProcessor, Microsoft.ApplicationInsights.SnapshotCollector">
   <!-- Override the default shadow copy folder. -->
   <ShadowCopyFolder>D:\SnapshotUploader</ShadowCopyFolder>
   <!-- Other SnapshotCollector configuration options -->
 </Add>
</TelemetryProcessors>
Or, if you're using appsettings.json with a .NET Core application:
{
  "ApplicationInsights": {
    "InstrumentationKey": "<your instrumentation key>"
  },
  "SnapshotCollectorConfiguration": {
    "ShadowCopyFolder": "D:\\SnapshotUploader"
  }
}
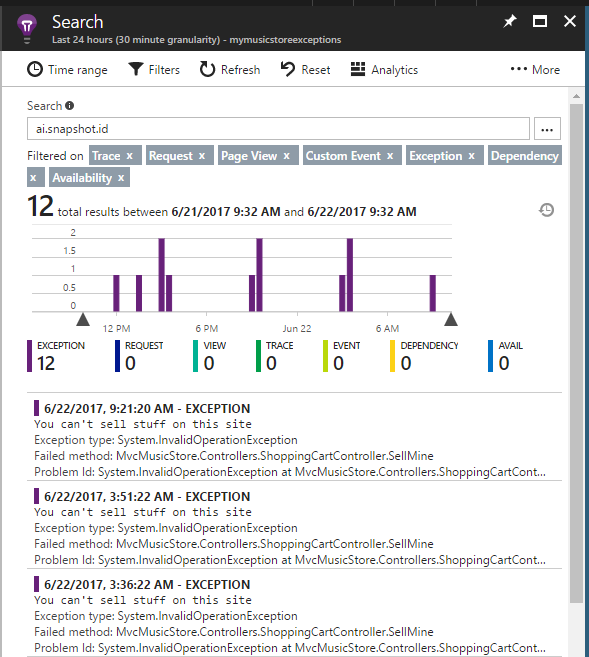
When a snapshot is created, the throwing exception is tagged with a snapshot ID. That snapshot ID is included as a custom property when the exception is reported to Application Insights. Using Search in Application Insights, you can find all records with the ai.snapshot.id custom property.
ai.snapshot.id in the Search text box and press Enter.

If this search returns no results, no snapshots were reported to Application Insights in the selected time range.
To search for a specific snapshot ID from the Uploader logs, type that ID in the Search box. If you can't find records for a snapshot that you know was uploaded, follow these steps:
Double-check that you're looking at the right Application Insights resource by verifying the instrumentation key.
Adjust the Time Range filter of the search to cover that time range by using the timestamp from the Uploader log.
If you still don't see an exception with that snapshot ID, then the exception record wasn't reported to Application Insights. This situation can happen if your application crashed after it took the snapshot but before it reported the exception record. In this case, check the App Service logs under Diagnose and solve problems to see if there were unexpected restarts or unhandled exceptions.
If your application connects to the Internet via a proxy or a firewall, you may need to update the rules to communicate with the Snapshot Debugger service.
The IPs used by Application Insights Snapshot Debugger are included in the Azure Monitor service tag. For more information, see Service Tags documentation.
If you have questions or need help, create a support request, or ask Azure community support. You can also submit product feedback to Azure feedback community.
Training
Learning path
AZ-204: Troubleshoot solutions by using Application Insights - Training
Learn how to instrument apps to enable Application Insights to monitor performance and help troubleshoot issues.