Eseguire il clustering dei dati in Android SDK
Quando si visualizzano molti punti dati sulla mappa, questi possono sovrapporsi l'uno all'altro. La sovrapposizione può rendere la mappa illeggibile e difficile da utilizzare. Il clustering dei dati dei punti è la combinazione di dati dei punti vicini tra loro e rappresentati sulla mappa come singolo punto dati in cluster. Quando l'utente ingrandisce la mappa, i cluster si scompongono nei singoli punti dati. Quando si lavora con un numero elevato di punti dati, è possibile implementare i processi di clustering per migliorare l'esperienza utente.
Nota
Ritiro di Android SDK di Mappe di Azure
Azure Maps Native SDK per Android è ora deprecato e verrà ritirato il 3/31/25. Per evitare interruzioni del servizio, eseguire la migrazione al Web SDK di Mappe di Azure entro il 31/3/25. Per altre informazioni, vedere La guida alla migrazione di Android SDK di Mappe di Azure.
Prerequisiti
Assicurarsi di completare la procedura descritta nel documento Guida introduttiva: creare un’app Android. È possibile inserire i blocchi di codice indicati in questo articolo nel gestore eventi onReady delle mappe.
Abilitazione del clustering su un'origine dati
Abilitare il clustering nella classe DataSource impostando l'opzione cluster su true. Impostare clusterRadius per selezionare i punti vicini e combinarli in un cluster. Il valore di clusterRadius è indicato in pixel. Utilizzare clusterMaxZoom per specificare un livello di zoom in corrispondenza del quale disabilitare la logica di clustering. Di seguito è riportato un esempio che illustra come abilitare il clustering in un'origine dati.
//Create a data source and enable clustering.
DataSource source = new DataSource(
    //Tell the data source to cluster point data.
    cluster(true),

    //The radius in pixels to cluster points together.
    clusterRadius(45),

    //The maximum zoom level in which clustering occurs.
    //If you zoom in more than this, all points are rendered as symbols.
    clusterMaxZoom(15)
);
 //Create a data source and enable clustering.
val source = DataSource(
    //Tell the data source to cluster point data.
    cluster(true),

    //The radius in pixels to cluster points together.
    clusterRadius(45),

    //The maximum zoom level in which clustering occurs.
    //If you zoom in more than this, all points are rendered as symbols.
    clusterMaxZoom(15)
)
Attenzione
Il clustering funziona solo con le funzionalità di Point. Se l'origine dati contiene funzionalità di altri tipi di geometria, ad esempio LineString o Polygon, si verifica un errore.
Suggerimento
Se due punti dati sono vicini, è possibile che il cluster non si scomponga mai, indipendentemente dal livello di ingrandimento selezionato dall'utente. Per risolvere questo problema, è possibile impostare l'opzione clusterMaxZoom sulla disabilitazione della logica di clustering per fare in modo che vengano visualizzati tutti gli elementi.
La classe DataSource fornisce anche i metodi seguenti correlati al clustering.
| metodo | Tipo restituito | Descrizione |
|---|---|---|
getClusterChildren(Feature clusterFeature) |
FeatureCollection |
Recupera gli elementi figlio del cluster specificato al livello di zoom successivo. Questi elementi figlio possono essere costituiti da una combinazione di forme e sottocluster. I sottocluster diventano funzionalità con proprietà corrispondenti a ClusteredProperties. |
getClusterExpansionZoom(Feature clusterFeature) |
int |
Calcola un livello di zoom in corrispondenza del quale il cluster inizia a espandersi o scomporsi. |
getClusterLeaves(Feature clusterFeature, long limit, long offset) |
FeatureCollection |
Recupera tutti i punti in un cluster. Impostare limit per restituire un subset dei punti e usare offset per spostarsi attraverso i punti. |
Visualizzare i cluster con un livello bolle
Il livello bolle è particolarmente indicato per il rendering dei punti in cluster. Usare le espressioni per ridimensionare il raggio e modificare il colore in base al numero di punti nel cluster. Se si sceglie di visualizzare i cluster tramite un livello bolle, è necessario usare un livello separato per eseguire il rendering dei punti dati non in cluster.
Per visualizzare le dimensioni del cluster nella parte superiore della bolla, usare un livello simbolo con testo, senza nessuna icona.
Il codice seguente visualizza i punti raggruppati usando un livello bolla e il numero di punti in ogni cluster usando un livello simbolo. Viene usato un secondo livello simbolo per visualizzare i singoli punti che non si trovano all'interno di un cluster.
//Create a data source and add it to the map.
DataSource source = new DataSource(
    //Tell the data source to cluster point data.
    cluster(true),

    //The radius in pixels to cluster points together.
    clusterRadius(45),

    //The maximum zoom level in which clustering occurs.
    //If you zoom in more than this, all points are rendered as symbols.
    clusterMaxZoom(15)
);

//Import the geojson data and add it to the data source.
map.importDataFromUrl("https://earthquake.usgs.gov/earthquakes/feed/v1.0/summary/all_week.geojson");

//Add data source to the map.
map.sources.add(source);

//Create a bubble layer for rendering clustered data points.
map.layers.add(new BubbleLayer(source,
    //Scale the size of the clustered bubble based on the number of points in the cluster.
    bubbleRadius(
        step(
            get("point_count"),
            20,             //Default of 20 pixel radius.
            stop(100, 30),  //If point_count >= 100, radius is 30 pixels.
            stop(750, 40)   //If point_count >= 750, radius is 40 pixels.
        )
    ),

    //Change the color of the cluster based on the value on the point_cluster property of the cluster.
    bubbleColor(
        step(
            toNumber(get("point_count")),
            color(Color.GREEN),              //Default to lime green.
            stop(100, color(Color.YELLOW)),  //If the point_count >= 100, color is yellow.
            stop(750, color(Color.RED))      //If the point_count >= 100, color is red.
        )
    ),

    bubbleStrokeWidth(0f),

    //Only rendered data points which have a point_count property, which clusters do.
    BubbleLayerOptions.filter(has("point_count"))
));

//Create a symbol layer to render the count of locations in a cluster.
map.layers.add(new SymbolLayer(source,
    iconImage("none"),                //Hide the icon image.
    textField(get("point_count")),    //Display the point count as text.
    textOffset(new Float[]{ 0f, 0.4f }),

    //Allow clustered points in this layer.
    SymbolLayerOptions.filter(has("point_count"))
));

//Create a layer to render the individual locations.
map.layers.add(new SymbolLayer(source,
    //Filter out clustered points from this layer.
    SymbolLayerOptions.filter(not(has("point_count")))
));
//Create a data source and add it to the map.
val source = DataSource(
    //Tell the data source to cluster point data.
    cluster(true),

    //The radius in pixels to cluster points together.
    clusterRadius(45),

    //The maximum zoom level in which clustering occurs.
    //If you zoom in more than this, all points are rendered as symbols.
    clusterMaxZoom(15)
)

//Import the geojson data and add it to the data source.
map.importDataFromUrl("https://earthquake.usgs.gov/earthquakes/feed/v1.0/summary/all_week.geojson")

//Add data source to the map.
map.sources.add(source)

//Create a bubble layer for rendering clustered data points.
map.layers.add(
    BubbleLayer(
        source,

        //Scale the size of the clustered bubble based on the number of points in the cluster.
        bubbleRadius(
            step(
                get("point_count"),
                20,  //Default of 20 pixel radius.
                stop(100, 30),  //If point_count >= 100, radius is 30 pixels.
                stop(750, 40) //If point_count >= 750, radius is 40 pixels.
            )
        ),

        //Change the color of the cluster based on the value on the point_cluster property of the cluster.
        bubbleColor(
            step(
                toNumber(get("point_count")),
                color(Color.GREEN),  //Default to lime green.
                stop(100, color(Color.YELLOW)),  //If the point_count >= 100, color is yellow.
                stop(750, color(Color.RED)) //If the point_count >= 100, color is red.
            )
        ),
        bubbleStrokeWidth(0f),

        //Only rendered data points which have a point_count property, which clusters do.
        BubbleLayerOptions.filter(has("point_count"))
    )
)

//Create a symbol layer to render the count of locations in a cluster.
map.layers.add(
    SymbolLayer(
        source,
        iconImage("none"),  //Hide the icon image.
        textField(get("point_count")),  //Display the point count as text.
        textOffset(arrayOf(0f, 0.4f)),

        //Allow clustered points in this layer.
        SymbolLayerOptions.filter(has("point_count"))
    )
)

//Create a layer to render the individual locations.
map.layers.add(
    SymbolLayer(
        source,

        //Filter out clustered points from this layer.
        SymbolLayerOptions.filter(not(has("point_count")))
    )
)
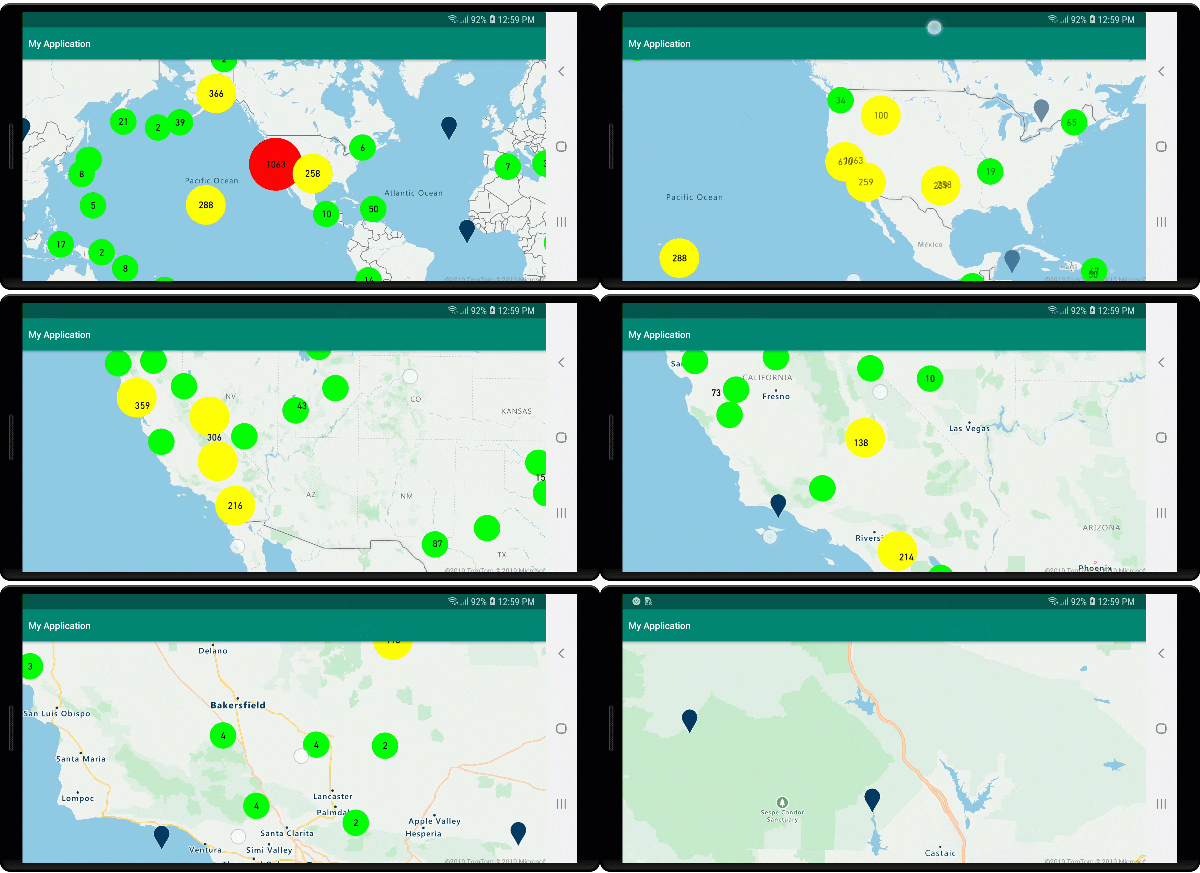
L'immagine seguente mostra come il codice precedente consenta di visualizzare le funzionalità dei punti raggruppati in un livello bolla, ridimensionate e colorate in base al numero di punti nel cluster. Il rendering dei punti non raggruppati viene eseguito usando un livello simbolo.
Visualizzare i cluster con un livello simbolo
Quando si visualizzano i punti dati, il livello simbolo nasconde automaticamente i simboli che si sovrappongono per un'interfaccia utente più pulita. Questo comportamento predefinito potrebbe non essere desiderato se si intende visualizzare la densità dei punti dati sulla mappa. Tuttavia, è possibile modificare queste impostazioni. Per visualizzare tutti i simboli, impostare l'opzione iconAllowOverlap del livello simbolo su true.
Usare il clustering per mostrare la densità dei punti dati mantenendo al contempo un'interfaccia utente pulita. L'esempio seguente mostra come aggiungere i simboli personalizzati e rappresentare i cluster e i singoli punti dati tramite il livello simbolo.
//Load all the custom image icons into the map resources.
map.images.add("earthquake_icon", R.drawable.earthquake_icon);
map.images.add("warning_triangle_icon", R.drawable.warning_triangle_icon);

//Create a data source and add it to the map.
DataSource source = new DataSource(
    //Tell the data source to cluster point data.
    cluster(true)
);

//Import the geojson data and add it to the data source.
map.importDataFromUrl("https://earthquake.usgs.gov/earthquakes/feed/v1.0/summary/all_week.geojson");

//Add data source to the map.
map.sources.add(source);

//Create a symbol layer to render the clusters.
map.layers.add(new SymbolLayer(source,
    iconImage("warning_triangle_icon"),
    textField(get("point_count")),
    textOffset(new Float[]{ 0f, -0.4f }),

    //Allow clustered points in this layer.
    filter(has("point_count"))
));

//Create a layer to render the individual locations.
map.layers.add(new SymbolLayer(source,
    iconImage("earthquake_icon"),

    //Filter out clustered points from this layer.
    filter(not(has("point_count")))
));
//Load all the custom image icons into the map resources.
map.images.add("earthquake_icon", R.drawable.earthquake_icon)
map.images.add("warning_triangle_icon", R.drawable.warning_triangle_icon)

//Create a data source and add it to the map.
val source = DataSource(
    //Tell the data source to cluster point data.
    cluster(true)
)

//Import the geojson data and add it to the data source.
map.importDataFromUrl("https://earthquake.usgs.gov/earthquakes/feed/v1.0/summary/all_week.geojson")

//Add data source to the map.
map.sources.add(source)

//Create a symbol layer to render the clusters.
map.layers.add(
    SymbolLayer(
        source,
        iconImage("warning_triangle_icon"),
        textField(get("point_count")),
        textOffset(arrayOf(0f, -0.4f)),

        //Allow clustered points in this layer.
        filter(has("point_count"))
    )
)

//Create a layer to render the individual locations.
map.layers.add(
    SymbolLayer(
        source,
        iconImage("earthquake_icon"),

        //Filter out clustered points from this layer.
        filter(not(has("point_count")))
    )
)
In questo esempio, l’immagine seguente è stata caricata nella cartella drawable dell’app.
| earthquake_icon.png | warning_triangle_icon.png |
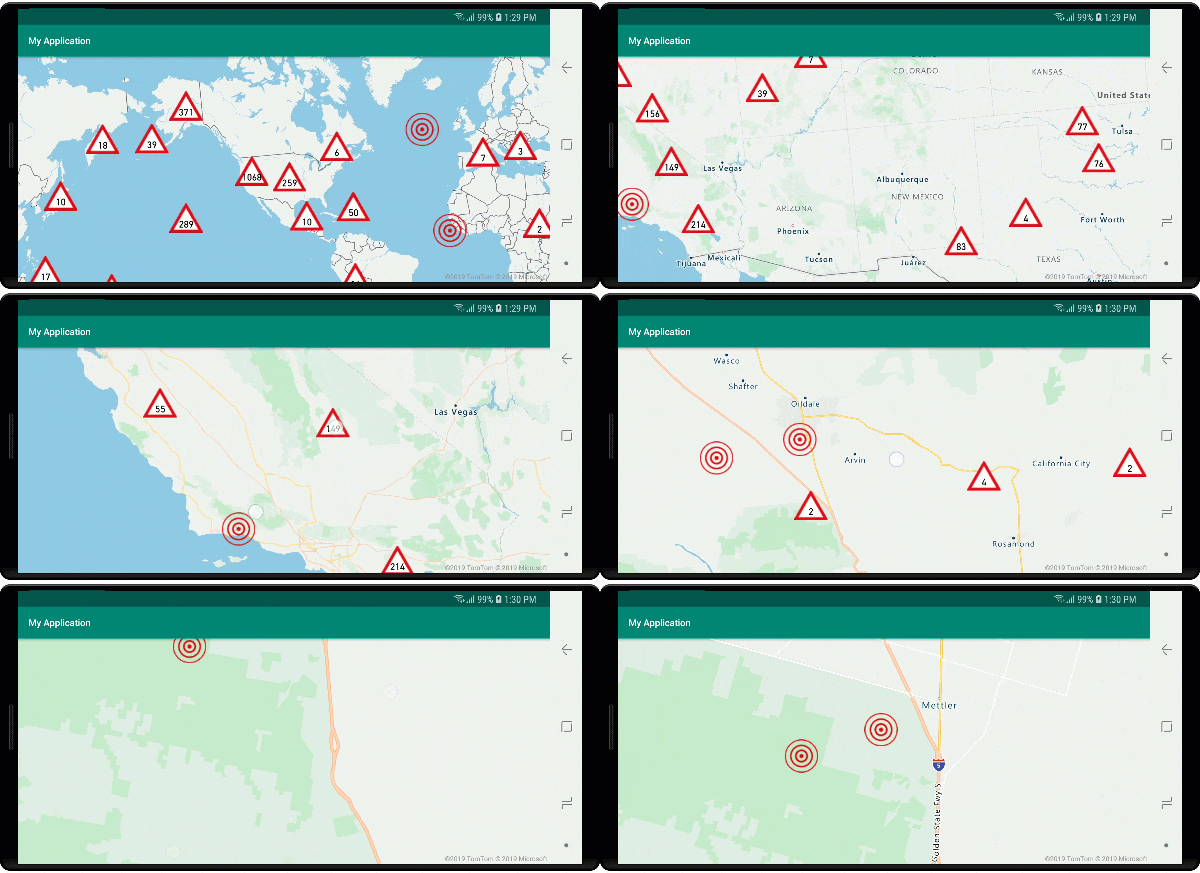
L'immagine seguente mostra come il codice precedente consenta di eseguire il rendering delle funzionalità dei punti raggruppati e non tramite l’uso di icone personalizzate.
Clustering e livello mappe termiche
Le mappe termiche rappresentano un ottimo modo per visualizzare la densità dei dati sulla mappa. Questo metodo di visualizzazione può gestire autonomamente un numero elevato di punti dati. Se i punti dati sono raggruppati nel cluster e le dimensioni del cluster vengono usate come peso della mappa termica, quest'ultima può gestire ancora più dati. A questo scopo, impostare l'opzione heatmapWeight del livello mappa termica su get("point_count"). Se il raggio del cluster è ridotto, la mappa termica è quasi identica a una mappa termica che usa punti dati non raggruppati, ma offre prestazioni nettamente migliori. Tuttavia, minore è il raggio del cluster, più accurata è la mappa termica e minori sono le prestazioni.
//Create a data source and add it to the map.
DataSource source = new DataSource(
    //Tell the data source to cluster point data.
    cluster(true),

    //The radius in pixels to cluster points together.
    clusterRadius(10)
);

//Import the geojson data and add it to the data source.
map.importDataFromUrl("https://earthquake.usgs.gov/earthquakes/feed/v1.0/summary/all_week.geojson");

//Add data source to the map.
map.sources.add(source);

//Create a heat map and add it to the map.
map.layers.add(new HeatMapLayer(source,
    //Set the weight to the point_count property of the data points.
    heatmapWeight(get("point_count")),

    //Optionally adjust the radius of each heat point.
    heatmapRadius(20f)
), "labels");
//Create a data source and add it to the map.
val source = DataSource(
    //Tell the data source to cluster point data.
    cluster(true),

    //The radius in pixels to cluster points together.
    clusterRadius(10)
)

//Import the geojson data and add it to the data source.
map.importDataFromUrl("https://earthquake.usgs.gov/earthquakes/feed/v1.0/summary/all_week.geojson")

//Add data source to the map.
map.sources.add(source)

//Create a heat map and add it to the map.
map.layers.add(
    HeatMapLayer(
        source,

        //Set the weight to the point_count property of the data points.
        heatmapWeight(get("point_count")),

        //Optionally adjust the radius of each heat point.
        heatmapRadius(20f)
    ), "labels"
)
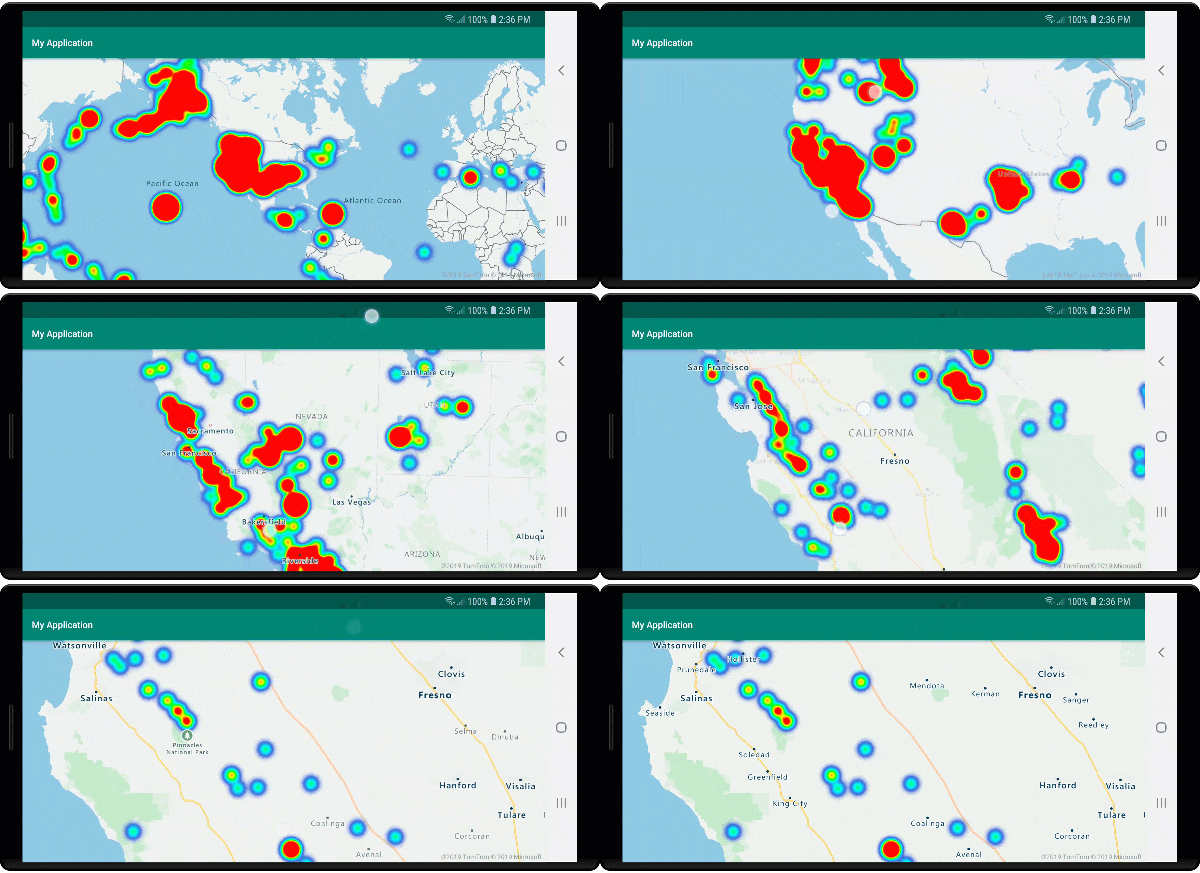
L'immagine seguente mostra come il codice precedente consenta di visualizzare una mappa termica ottimizzata usando le funzionalità dei punti raggruppati e il numero di cluster come peso nella mappa termica.
Eventi del mouse sui punti dati in cluster
Quando si verificano eventi del mouse su un livello contenente punti dati in cluster, questi ultimi vengono restituiti all'evento sotto forma di oggetti della funzionalità punto GeoJSON. Questa funzionalità dei punti dispone delle proprietà seguenti:
| Nome proprietà | Type | Descrizione |
|---|---|---|
cluster |
boolean | Indica se la funzionalità rappresenta un cluster. |
point_count |
number | Numero di punti contenuti nel cluster. |
point_count |
number | Numero di punti contenuti nel cluster. |
point_count_abbreviated |
string | Stringa che abbrevia il valore point_count se necessario. Ad esempio, 4.000 diventa 4K. |
In questo esempio un livello bolle esegue il rendering dei punti del cluster e aggiunge un evento Click. Quando l'evento Click si attiva, il codice calcola e ingrandisce la mappa fino al livello di zoom successivo, in corrispondenza del quale il cluster si scompone. Questa funzionalità viene implementata tramite il metodo getClusterExpansionZoom della classe DataSource e la proprietà cluster_id del punto dati in cluster selezionato.
//Create a data source and add it to the map.
DataSource source = new DataSource(
    //Tell the data source to cluster point data.
    cluster(true),

    //The radius in pixels to cluster points together.
    clusterRadius(45),

    //The maximum zoom level in which clustering occurs.
    //If you zoom in more than this, all points are rendered as symbols.
    clusterMaxZoom(15)
);

//Import the geojson data and add it to the data source.
source.importDataFromUrl("https://earthquake.usgs.gov/earthquakes/feed/v1.0/summary/all_week.geojson");

//Add data source to the map.
map.sources.add(source);

//Create a bubble layer for rendering clustered data points.
BubbleLayer clusterBubbleLayer = new BubbleLayer(source,
    //Scale the size of the clustered bubble based on the number of points in the cluster.
    bubbleRadius(
        step(
            get("point_count"),
            20f,    //Default of 20 pixel radius.
            stop(100, 30),   //If point_count >= 100, radius is 30 pixels.
            stop(750, 40)    //If point_count >= 750, radius is 40 pixels.
        )
    ),

    //Change the color of the cluster based on the value on the point_cluster property of the cluster.
    bubbleColor(
        step(
            get("point_count"),
            color(Color.GREEN),  //Default to green.
            stop(100, color(Color.YELLOW)), //If the point_count >= 100, color is yellow.
            stop(750, color(Color.RED))     //If the point_count >= 100, color is red.
        )
    ),

    bubbleStrokeWidth(0f),

    //Only rendered data points which have a point_count property, which clusters do.
    BubbleLayerOptions.filter(has("point_count"))
);

//Add the clusterBubbleLayer and two additional layers to the map.
map.layers.add(clusterBubbleLayer);

//Create a symbol layer to render the count of locations in a cluster.
map.layers.add(new SymbolLayer(source,
    //Hide the icon image.
    iconImage("none"),

    //Display the 'point_count_abbreviated' property value.
    textField(get("point_count_abbreviated")),

    //Offset the text position so that it's centered nicely.
    textOffset(new Float[] { 0f, 0.4f }),

    //Only rendered data points which have a point_count property, which clusters do.
    SymbolLayerOptions.filter(has("point_count"))
));

//Create a layer to render the individual locations.
map.layers.add(new SymbolLayer(source,
    //Filter out clustered points from this layer.
    SymbolLayerOptions.filter(not(has("point_count")))
));

//Add a click event to the cluster layer so we can zoom in when a user clicks a cluster.
map.events.add((OnFeatureClick) (features) -> {
    if(features.size() > 0) {
        //Get the clustered point from the event.
        Feature cluster = features.get(0);

        //Get the cluster expansion zoom level. This is the zoom level at which the cluster starts to break apart.
        int expansionZoom = source.getClusterExpansionZoom(cluster);

        //Update the map camera to be centered over the cluster.
        map.setCamera(
            //Center the map over the cluster points location.
            center((Point)cluster.geometry()),

            //Zoom to the clusters expansion zoom level.
            zoom(expansionZoom),

            //Animate the movement of the camera to the new position.
            animationType(AnimationType.EASE),
            animationDuration(200)
        );
    }

    //Return true indicating if event should be consumed and not passed further to other listeners registered afterwards, false otherwise.
    return true;
}, clusterBubbleLayer);
//Create a data source and add it to the map.
val source = DataSource( //Tell the data source to cluster point data.
    //The radius in pixels to cluster points together.
    cluster(true),

    //The maximum zoom level in which clustering occurs.
    clusterRadius(45),

    //If you zoom in more than this, all points are rendered as symbols.
    clusterMaxZoom(15)
)

//Import the geojson data and add it to the data source.
source.importDataFromUrl("https://earthquake.usgs.gov/earthquakes/feed/v1.0/summary/all_week.geojson")

//Add data source to the map.
map.sources.add(source)

//Create a bubble layer for rendering clustered data points.
val clusterBubbleLayer = BubbleLayer(
    source,

    //Scale the size of the clustered bubble based on the number of points in the cluster.
    bubbleRadius(
        step(
            get("point_count"),
            20f,  //Default of 20 pixel radius.
            stop(100, 30),  //If point_count >= 100, radius is 30 pixels.
            stop(750, 40) //If point_count >= 750, radius is 40 pixels.
        )
    ),

    //Change the color of the cluster based on the value on the point_cluster property of the cluster.
    bubbleColor(
        step(
            get("point_count"),
            color(Color.GREEN),  //Default to green.
            stop(
                100,
                color(Color.YELLOW)
            ),  //If the point_count >= 100, color is yellow.
            stop(750, color(Color.RED)) //If the point_count >= 100, color is red.
        )
    ),

    bubbleStrokeWidth(0f),

    //Only rendered data points which have a point_count property, which clusters do.
    BubbleLayerOptions.filter(has("point_count"))
)

//Add the clusterBubbleLayer and two additional layers to the map.
map.layers.add(clusterBubbleLayer)

//Create a symbol layer to render the count of locations in a cluster.
map.layers.add(
    SymbolLayer(
        source,

        //Hide the icon image.
        iconImage("none"),

        //Display the 'point_count_abbreviated' property value.
        textField(get("point_count_abbreviated")),

        //Offset the text position so that it's centered nicely.
        textOffset(
            arrayOf(
                0f,
                0.4f
            )
        ),

        //Only rendered data points which have a point_count property, which clusters do.
        SymbolLayerOptions.filter(has("point_count"))
    )
)

//Create a layer to render the individual locations.
map.layers.add(
    SymbolLayer(
        source,

        //Filter out clustered points from this layer.
        SymbolLayerOptions.filter(not(has("point_count")))
    )
)

//Add a click event to the cluster layer so we can zoom in when a user clicks a cluster.
map.events.add(OnFeatureClick { features: List<Feature?>? ->
    if (features.size() > 0) {
        //Get the clustered point from the event.
        val cluster: Feature = features.get(0)

        //Get the cluster expansion zoom level. This is the zoom level at which the cluster starts to break apart.
        val expansionZoom: Int = source.getClusterExpansionZoom(cluster)

        //Update the map camera to be centered over the cluster.
        map.setCamera(

            //Center the map over the cluster points location.
            center(cluster.geometry() as Point?),

            //Zoom to the clusters expansion zoom level.
            zoom(expansionZoom),

            //Animate the movement of the camera to the new position.
            animationType(AnimationType.EASE),
            animationDuration(200)
        )
    }
    true
}, clusterBubbleLayer)
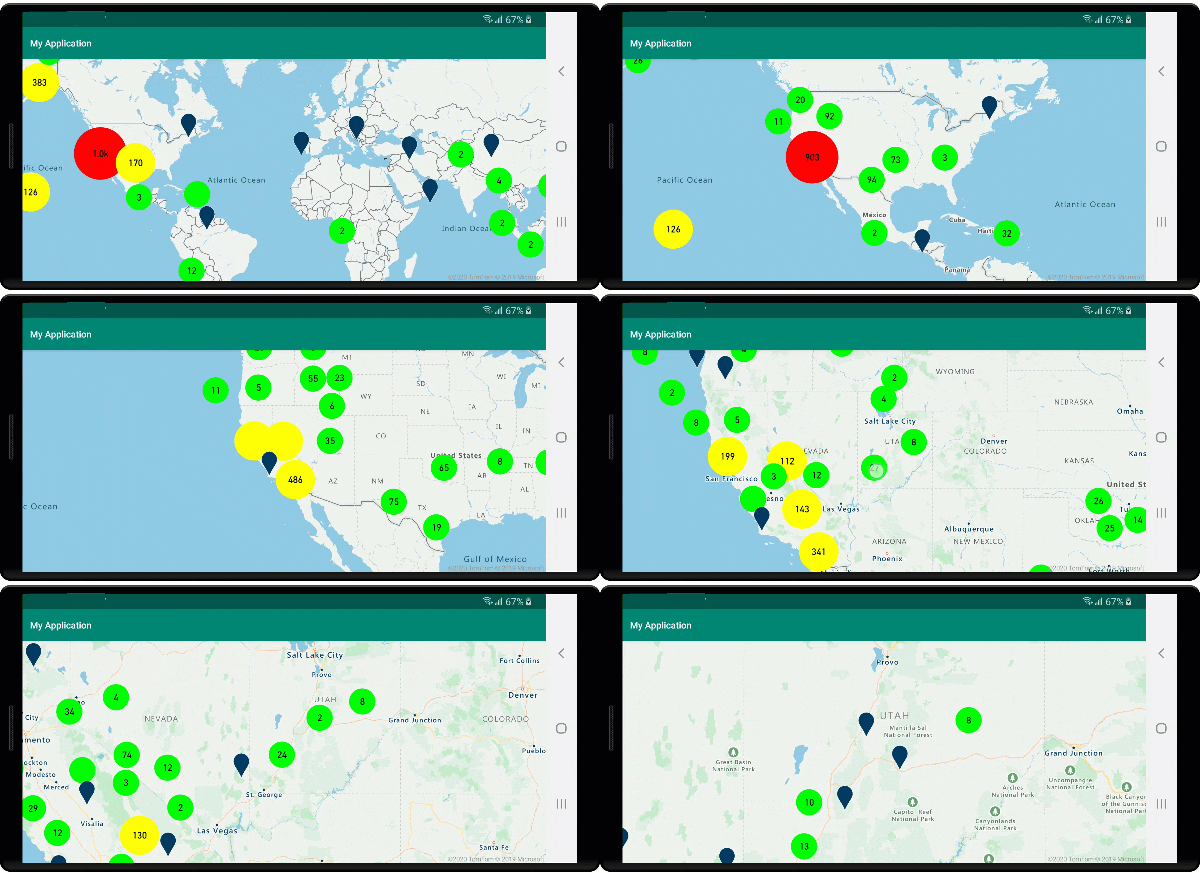
L'immagine seguente mostra come il codice precedente consenta di visualizzare i punti raggruppati su una mappa che, se selezionata, ingrandisce il livello di zoom successivo in corrispondenza del quale un cluster inizia a scomporsi ed espandersi.
Visualizzare l'area del cluster
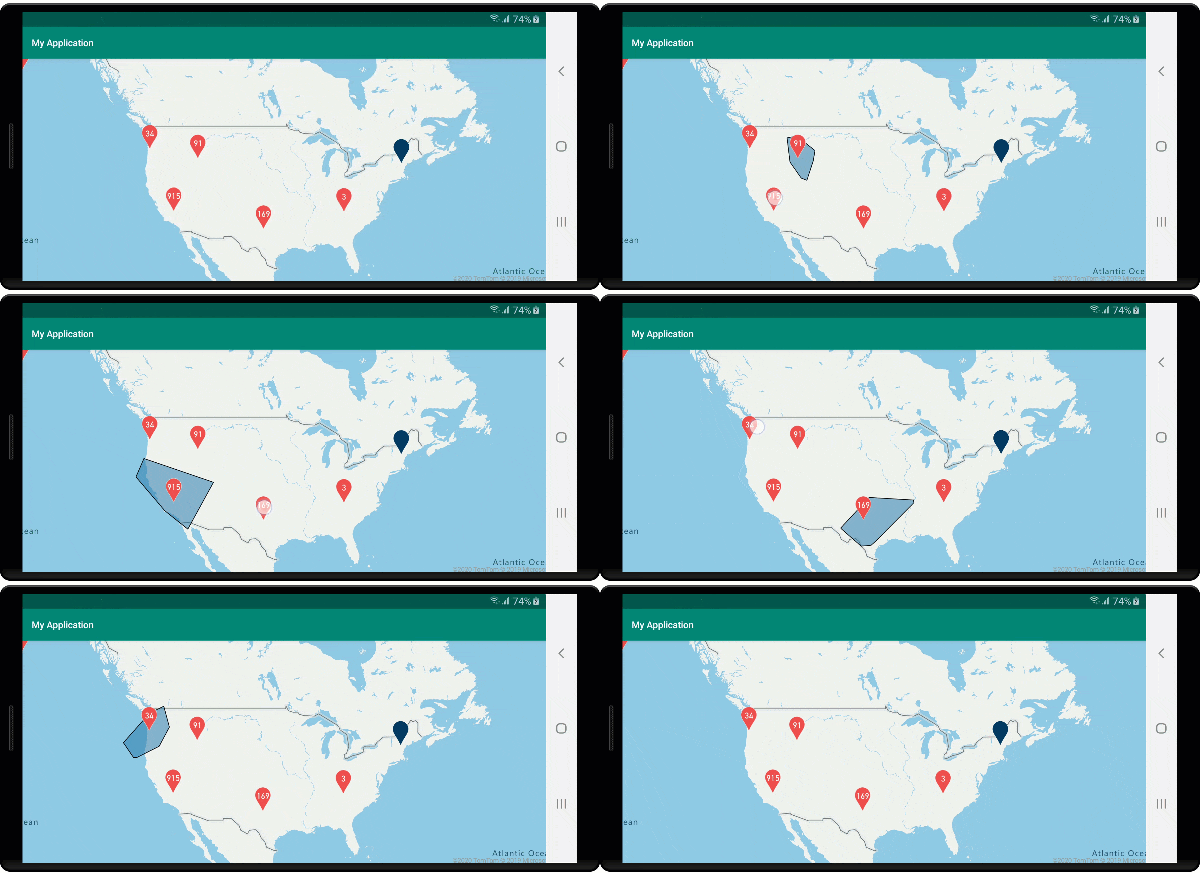
I dati dei punti rappresentati da un cluster sono distribuiti in un'area. In questo esempio, quando si passa il mouse su un cluster, si verificano due comportamenti principali. Per prima cosa, i singoli punti dati contenuti nel cluster verranno usati per calcolare un hull convesso. Quindi, sulla mappa viene visualizzato l'hull convesso per mostrare un'area. Un hull convesso è un poligono che esegue il wrapping di un set di punti come se fosse una banda elastica e può essere calcolato usando il metodo atlas.math.getConvexHull. Tutti i punti contenuti in un cluster possono essere recuperati dall'origine dati tramite il metodo getClusterLeaves.
//Create a data source and add it to the map.
DataSource source = new DataSource(
    //Tell the data source to cluster point data.
    cluster(true)
);

//Import the geojson data and add it to the data source.
source.importDataFromUrl("https://earthquake.usgs.gov/earthquakes/feed/v1.0/summary/all_week.geojson");

//Add data source to the map.
map.sources.add(source);

//Create a data source for the convex hull polygon. Since this will be updated frequently it is more efficient to separate this into its own data source.
DataSource polygonDataSource = new DataSource();

//Add data source to the map.
map.sources.add(polygonDataSource);

//Add a polygon layer and a line layer to display the convex hull.
map.layers.add(new PolygonLayer(polygonDataSource));
map.layers.add(new LineLayer(polygonDataSource));

//Create a symbol layer to render the clusters.
SymbolLayer clusterLayer = new SymbolLayer(source,
    iconImage("marker-red"),
    textField(get("point_count_abbreviated")),
    textOffset(new Float[] { 0f, -1.2f }),
    textColor(Color.WHITE),
    textSize(14f),

    //Only rendered data points which have a point_count property, which clusters do.
    SymbolLayerOptions.filter(has("point_count"))
);
map.layers.add(clusterLayer);

//Create a layer to render the individual locations.
map.layers.add(new SymbolLayer(source,
    //Filter out clustered points from this layer.
    SymbolLayerOptions.filter(not(has("point_count")))
));

//Add a click event to the layer so we can calculate the convex hull of all the points within a cluster.
map.events.add((OnFeatureClick) (features) -> {
    if(features.size() > 0) {
        //Get the clustered point from the event.
        Feature cluster = features.get(0);

        //Get all points in the cluster. Set the offset to 0 and the max long value to return all points.
        FeatureCollection leaves = source.getClusterLeaves(cluster, Long.MAX_VALUE, 0);

        //Get the point features from the feature collection.
        List<Feature> childFeatures = leaves.features();

        //When only two points in a cluster. Render a line.
        if(childFeatures.size() == 2){
            //Extract the geometry points from the child features.
            List<Point> points = new ArrayList();

            childFeatures.forEach(f -> {
                points.add((Point)f.geometry());
            });

            //Create a line from the points.
            polygonDataSource.setShapes(LineString.fromLngLats(points));
        } else {
            Polygon hullPolygon = MapMath.getConvexHull(leaves);

            //Overwrite all data in the polygon data source with the newly calculated convex hull polygon.
            polygonDataSource.setShapes(hullPolygon);
        }
    }

    //Return true indicating if event should be consumed and not passed further to other listeners registered afterwards, false otherwise.
    return true;
}, clusterLayer);
//Create a data source and add it to the map.
val source = DataSource(
    //Tell the data source to cluster point data.
    cluster(true)
)

//Import the geojson data and add it to the data source.
source.importDataFromUrl("https://earthquake.usgs.gov/earthquakes/feed/v1.0/summary/all_week.geojson")

//Add data source to the map.
map.sources.add(source)

//Create a data source for the convex hull polygon. Since this will be updated frequently it is more efficient to separate this into its own data source.
val polygonDataSource = DataSource()

//Add data source to the map.
map.sources.add(polygonDataSource)

//Add a polygon layer and a line layer to display the convex hull.
map.layers.add(PolygonLayer(polygonDataSource))
map.layers.add(LineLayer(polygonDataSource))

//Create a symbol layer to render the clusters.
val clusterLayer = SymbolLayer(
    source,
    iconImage("marker-red"),
    textField(get("point_count_abbreviated")),
    textOffset(arrayOf(0f, -1.2f)),
    textColor(Color.WHITE),
    textSize(14f),

    //Only rendered data points which have a point_count property, which clusters do.
    SymbolLayerOptions.filter(has("point_count"))
)
map.layers.add(clusterLayer)

//Create a layer to render the individual locations.
map.layers.add(
    SymbolLayer(
        source,

        //Filter out clustered points from this layer.
        SymbolLayerOptions.filter(not(has("point_count")))
    )
)

//Add a click event to the layer so we can calculate the convex hull of all the points within a cluster.
map.events.add(OnFeatureClick { features: List<Feature?>? ->
    if (features.size() > 0) {
        //Get the clustered point from the event.
        val cluster: Feature = features.get(0)

        //Get all points in the cluster. Set the offset to 0 and the max long value to return all points.
        val leaves: FeatureCollection = source.getClusterLeaves(cluster, Long.MAX_VALUE, 0)

        //Get the point features from the feature collection.
        val childFeatures = leaves.features()

        //When only two points in a cluster. Render a line.
        if (childFeatures!!.size == 2) {
            //Extract the geometry points from the child features.
            val points: MutableList<Point?> = ArrayList()
            childFeatures!!.forEach(Consumer { f: Feature ->
                points.add(
                    f.geometry() as Point?
                )
            })

            //Create a line from the points.
            polygonDataSource.setShapes(LineString.fromLngLats(points))
        } else {
            val hullPolygon: Polygon = MapMath.getConvexHull(leaves)

            //Overwrite all data in the polygon data source with the newly calculated convex hull polygon.
            polygonDataSource.setShapes(hullPolygon)
        }
    }
    true
}, clusterLayer)
L'immagine seguente mostra come il codice precedente consenta di visualizzare l'area di tutti i punti all'interno di un’area raggruppata selezionata.
Aggregazione dei dati nei cluster
Spesso i cluster sono rappresentati da un simbolo in cui è indicato il numero di punti che contengono. Tuttavia, a volte è opportuno personalizzare lo stile dei cluster con metriche aggiuntive. È possibile usare le proprietà del cluster per creare proprietà personalizzate che equivalgano a un calcolo basato sulle proprietà all'interno di ogni punto con un cluster. È possibile definire le proprietà del cluster nell'opzione clusterProperties di DataSource.
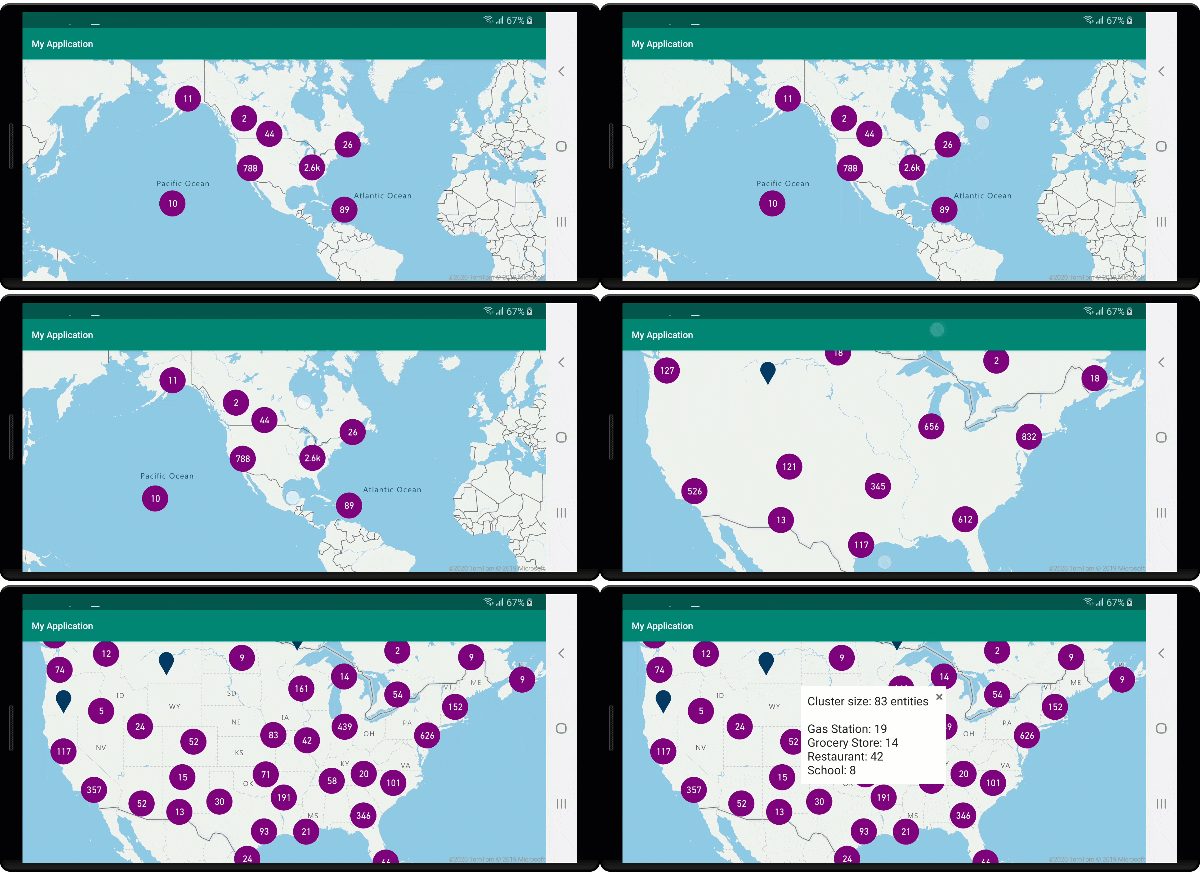
Il codice seguente calcola un numero in base alla proprietà del tipo di entità di ogni punto dati in un cluster. Quando un utente seleziona un cluster, viene visualizzata una finestra popup con informazioni aggiuntive su tale cluster.
//An array of all entity type property names in features of the data set.
String[] entityTypes = new String[] { "Gas Station", "Grocery Store", "Restaurant", "School" };

//Create a popup and add it to the map.
Popup popup = new Popup();
map.popups.add(popup);

//Close the popup initially.
popup.close();

//Create a data source and add it to the map.
source = new DataSource(
    //Tell the data source to cluster point data.
    cluster(true),

    //The radius in pixels to cluster points together.
    clusterRadius(50),

    //Calculate counts for each entity type in a cluster as custom aggregate properties.
    clusterProperties(new ClusterProperty[]{
        new ClusterProperty("Gas Station", sum(accumulated(), get("Gas Station")), switchCase(eq(get("EntityType"), literal("Gas Station")), literal(1), literal(0))),
        new ClusterProperty("Grocery Store", sum(accumulated(), get("Grocery Store")), switchCase(eq(get("EntityType"), literal("Grocery Store")), literal(1), literal(0))),
        new ClusterProperty("Restaurant", sum(accumulated(), get("Restaurant")), switchCase(eq(get("EntityType"), literal("Restaurant")), literal(1), literal(0))),
        new ClusterProperty("School", sum(accumulated(), get("School")), switchCase(eq(get("EntityType"), literal("School")), literal(1), literal(0)))
    })
);

//Import the geojson data and add it to the data source.
source.importDataFromUrl("https://samples.azuremaps.com/data/geojson/SamplePoiDataSet.json");

//Add data source to the map.
map.sources.add(source);

//Create a bubble layer for rendering clustered data points.
BubbleLayer clusterBubbleLayer = new BubbleLayer(source,
    bubbleRadius(20f),
    bubbleColor("purple"),
    bubbleStrokeWidth(0f),

    //Only rendered data points which have a point_count property, which clusters do.
    BubbleLayerOptions.filter(has("point_count"))
);

//Add the clusterBubbleLayer and two additional layers to the map.
map.layers.add(clusterBubbleLayer);

//Create a symbol layer to render the count of locations in a cluster.
map.layers.add(new SymbolLayer(source,
    //Hide the icon image.
    iconImage("none"),

    //Display the 'point_count_abbreviated' property value.
    textField(get("point_count_abbreviated")),

    textColor(Color.WHITE),
    textOffset(new Float[] { 0f, 0.4f }),

    //Only rendered data points which have a point_count property, which clusters do.
    SymbolLayerOptions.filter(has("point_count"))
));

//Create a layer to render the individual locations.
map.layers.add(new SymbolLayer(source,
    //Filter out clustered points from this layer.
    SymbolLayerOptions.filter(not(has("point_count")))
));

//Add a click event to the cluster layer and display the aggregate details of the cluster.
map.events.add((OnFeatureClick) (features) -> {
    if(features.size() > 0) {
        //Get the clustered point from the event.
        Feature cluster = features.get(0);

        //Create a number formatter that removes decimal places.
        NumberFormat nf = DecimalFormat.getInstance();
        nf.setMaximumFractionDigits(0);

        //Create the popup's content.
        StringBuilder sb = new StringBuilder();

        sb.append("Cluster size: ");
        sb.append(nf.format(cluster.getNumberProperty("point_count")));
        sb.append(" entities\n");

        for(int i = 0; i < entityTypes.length; i++) {
            sb.append("\n");

            //Get the entity type name.
            sb.append(entityTypes[i]);
            sb.append(": ");

            //Get the aggregated entity type count from the properties of the cluster by name.
            sb.append(nf.format(cluster.getNumberProperty(entityTypes[i])));
        }

        //Retrieve the custom layout for the popup.
        View customView = LayoutInflater.from(this).inflate(R.layout.popup_text, null);

        //Access the text view within the custom view and set the text to the title property of the feature.
        TextView tv = customView.findViewById(R.id.message);
        tv.setText(sb.toString());

        //Get the position of the cluster.
        Position pos = MapMath.getPosition((Point)cluster.geometry());

        //Set the options on the popup.
        popup.setOptions(
            //Set the popups position.
            position(pos),

            //Set the anchor point of the popup content.
            anchor(AnchorType.BOTTOM),

            //Set the content of the popup.
            content(customView)
        );

        //Open the popup.
        popup.open();
    }

    //Return a boolean indicating if event should be consumed or continue bubble up.
    return true;
}, clusterBubbleLayer);
//An array of all entity type property names in features of the data set.
val entityTypes = arrayOf("Gas Station", "Grocery Store", "Restaurant", "School")

//Create a popup and add it to the map.
val popup = Popup()
map.popups.add(popup)

//Close the popup initially.
popup.close()

//Create a data source and add it to the map.
val source = DataSource(
    //Tell the data source to cluster point data.
    cluster(true),

    //The radius in pixels to cluster points together.
    clusterRadius(50),

    //Calculate counts for each entity type in a cluster as custom aggregate properties.
    clusterProperties(
        arrayOf<ClusterProperty>(
            ClusterProperty("Gas Station", sum(accumulated(), get("Gas Station")), switchCase(eq(get("EntityType"), literal("Gas Station")), literal(1), literal(0))),
            ClusterProperty("Grocery Store", sum(accumulated(), get("Grocery Store")), switchCase(eq(get("EntityType"), literal("Grocery Store")), literal(1), literal(0))),
            ClusterProperty("Restaurant", sum(accumulated(), get("Restaurant")), switchCase(eq(get("EntityType"), literal("Restaurant")), literal(1), literal(0))),
            ClusterProperty("School", sum(accumulated(), get("School")), switchCase(eq(get("EntityType"), literal("School")), literal(1), literal(0)))
        )
    )
)

//Import the geojson data and add it to the data source.
source.importDataFromUrl("https://samples.azuremaps.com/data/geojson/SamplePoiDataSet.json")

//Add data source to the map.
map.sources.add(source)

//Create a bubble layer for rendering clustered data points.
val clusterBubbleLayer = BubbleLayer(
    source,
    bubbleRadius(20f),
    bubbleColor("purple"),
    bubbleStrokeWidth(0f),

    //Only rendered data points which have a point_count property, which clusters do.
    BubbleLayerOptions.filter(has("point_count"))
)

//Add the clusterBubbleLayer and two additional layers to the map.
map.layers.add(clusterBubbleLayer)

//Create a symbol layer to render the count of locations in a cluster.
map.layers.add(
    SymbolLayer(
        source,

        //Hide the icon image.
        iconImage("none"),

        //Display the 'point_count_abbreviated' property value.
        textField(get("point_count_abbreviated")),

        textColor(Color.WHITE),
        textOffset(arrayOf(0f, 0.4f)),

        //Only rendered data points which have a point_count property, which clusters do.
        SymbolLayerOptions.filter(has("point_count"))
    )
)

//Create a layer to render the individual locations.
map.layers.add(
    SymbolLayer(
        source,

        //Filter out clustered points from this layer.
        SymbolLayerOptions.filter(not(has("point_count")))
    )
)

//Add a click event to the cluster layer and display the aggregate details of the cluster.
map.events.add(OnFeatureClick { features: List<Feature> ->
    if (features.size > 0) {
        //Get the clustered point from the event.
        val cluster = features[0]

        //Create a number formatter that removes decimal places.
        val nf: NumberFormat = DecimalFormat.getInstance()
        nf.setMaximumFractionDigits(0)

        //Create the popup's content.
        val sb = StringBuilder()

        sb.append("Cluster size: ")
        sb.append(nf.format(cluster.getNumberProperty("point_count")))
        sb.append(" entities\n")

        for (i in entityTypes.indices) {
            sb.append("\n")

            //Get the entity type name.
            sb.append(entityTypes[i])
            sb.append(": ")

            //Get the aggregated entity type count from the properties of the cluster by name.
            sb.append(nf.format(cluster.getNumberProperty(entityTypes[i])))
        }

        //Retrieve the custom layout for the popup.
        val customView: View = LayoutInflater.from(this).inflate(R.layout.popup_text, null)

        //Access the text view within the custom view and set the text to the title property of the feature.
        val tv: TextView = customView.findViewById(R.id.message)
        tv.text = sb.toString()

        //Get the position of the cluster.
        val pos: Position = MapMath.getPosition(cluster.geometry() as Point?)

        //Set the options on the popup.
        popup.setOptions(
            //Set the popups position.
            position(pos),

            //Set the anchor point of the popup content.
            anchor(AnchorType.BOTTOM),

            //Set the content of the popup.
            content(customView)
        )

        //Open the popup.
        popup.open()
    }

    //Return a boolean indicating if event should be consumed or continue bubble up.
    true
} as OnFeatureClick, clusterBubbleLayer)
Il popup segue la procedura descritta nel documento Visualizzare una finestra popup.
L'immagine seguente mostra come il codice precedente consenta di visualizzare una finestra popup con conteggi aggregati di ogni tipo di valore di entità per tutti i punti nel punto cluster selezionato.
Passaggi successivi
Per aggiungere altri dati alla mappa: