Aggiungere un livello a bolle a una mappa (Android SDK)
Questo articolo illustra come eseguire il rendering di dati di punti da un'origine dati come un livello a bolle su una mappa. I livelli a bolle eseguono il rendering di punti come cerchi con un raggio di pixel fisso sulla mappa.
Nota
Ritiro di Android SDK di Mappe di Azure
Azure Maps Native SDK per Android è ora deprecato e verrà ritirato il 3/31/25. Per evitare interruzioni del servizio, eseguire la migrazione al Web SDK di Mappe di Azure entro il 31/3/25. Per altre informazioni, vedere La guida alla migrazione di Android SDK di Mappe di Azure.
Suggerimento
Per impostazione predefinita i livelli bolle eseguiranno il rendering delle coordinate di tutte le geometrie in un'origine dati. Per limitare il livello in modo che esegua solo il rendering delle caratteristiche geometriche dei punti, impostare l’opzione filter del livello su eq(geometryType(), "Point"). Per includere anche le funzionalità MultiPoint, impostare l’opzione filter del livello su any(eq(geometryType(), "Point"), eq(geometryType(), "MultiPoint")).
Prerequisiti
Completare la procedura descritta nell’articolo Avvio rapido: creare un’app Android. I blocchi di codice in questo articolo possono essere inseriti nel gestore eventi onReady delle mappe.
Aggiungere un livello per le bolle
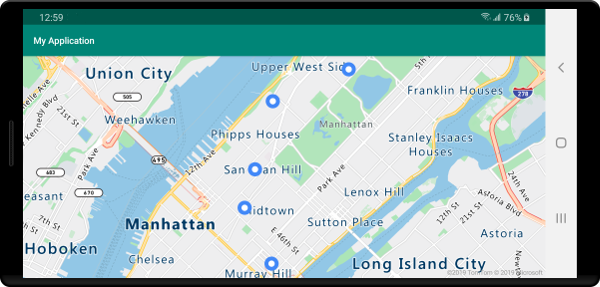
Il codice seguente carica una matrice di punti in un'origine dati. Quindi, connette i punti dati a un livello a bolle. Il livello a bolle esegue il rendering del raggio di ogni bolla con cinque pixel e di un colore di riempimento bianco. Inoltre, anche di un colore di tratto blu e una larghezza del tratto di sei pixel.
//Create a data source and add it to the map.
DataSource source = new DataSource();
map.sources.add(source);

//Create point locations.
Point[] points = new Point[] {
    Point.fromLngLat(-73.985708, 40.75773),
    Point.fromLngLat(-73.985600, 40.76542),
    Point.fromLngLat(-73.985550, 40.77900),
    Point.fromLngLat(-73.975550, 40.74859),
    Point.fromLngLat(-73.968900, 40.78859)
};

//Add multiple points to the data source.
source.add(points);

//Create a bubble layer to render the filled in area of the circle, and add it to the map.
BubbleLayer layer = new BubbleLayer(source,
    bubbleRadius(5f),
    bubbleColor("white"),
    bubbleStrokeColor("#4288f7"),
    bubbleStrokeWidth(6f)
);

map.layers.add(layer);
//Create a data source and add it to the map.
val source = DataSource()
map.sources.add(source)

//Create point locations.
val points: Array<Point> = arrayOf<Point>(
    Point.fromLngLat(-73.985708, 40.75773),
    Point.fromLngLat(-73.985600, 40.76542),
    Point.fromLngLat(-73.985550, 40.77900),
    Point.fromLngLat(-73.975550, 40.74859),
    Point.fromLngLat(-73.968900, 40.78859)
)

//Add multiple points to the data source.
source.add(points)

//Create a bubble layer to render the filled in area of the circle, and add it to the map.
val layer = BubbleLayer(
    source,
    bubbleRadius(5f),
    bubbleColor("white"),
    bubbleStrokeColor("#4288f7"),
    bubbleStrokeWidth(6f)
)

map.layers.add(layer)
Lo screenshot seguente mostra il rendering dei punti nel codice precedente in un livello a bolle.

Mostrare etichette con un livello bolle
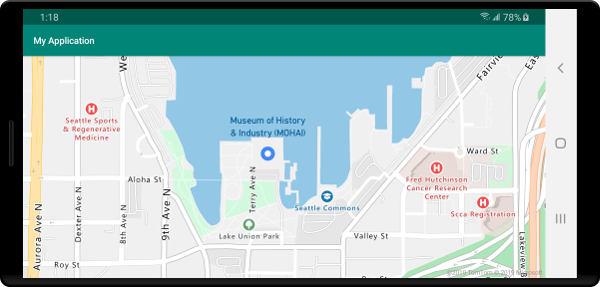
Questo codice illustra come usare un livello a bolle per eseguire il rendering di un punto sulla mappa. E come usare un livello a simboli per eseguire il rendering di un’etichetta. Per nascondere l’icona del livello a simboli, impostare l’opzione iconImage su "none".
//Create a data source and add it to the map.
DataSource source = new DataSource();
map.sources.add(source);

//Add a data point to the map.
source.add(Point.fromLngLat(-122.336641,47.627631));

//Add a bubble layer.
map.layers.add(new BubbleLayer(source,
    bubbleRadius(5f),
    bubbleColor("white"),
    bubbleStrokeColor("#4288f7"),
    bubbleStrokeWidth(6f)
));

//Add a symbol layer to display text, hide the icon image.
map.layers.add(new SymbolLayer(source,
    //Hide the icon image.
    iconImage("none"),
    textField("Museum of History & Industry (MOHAI)"),
    textColor("#005995"),
    textOffset(new Float[]{0f, -2.2f})
));
//Create a data source and add it to the map.
val source = DataSource()
map.sources.add(source)

//Add a data point to the map.
source.add(Point.fromLngLat(-122.336641, 47.627631))

//Add a bubble layer.
map.layers.add(
    BubbleLayer(
        source,
        bubbleRadius(5f),
        bubbleColor("white"),
        bubbleStrokeColor("#4288f7"),
        bubbleStrokeWidth(6f)
    )
)

//Add a symbol layer to display text, hide the icon image.
map.layers.add(
    SymbolLayer(
        source,  //Hide the icon image.
        iconImage("none"),
        textField("Museum of History & Industry (MOHAI)"),
        textColor("#005995"),
        textOffset(arrayOf(0f, -2.2f))
    )
)
Lo screenshot seguente mostra il codice precedente che esegue il rendering di un punto in un livello a bolle e di un’etichetta di testo per il punto con un livello a simboli.

Passaggi successivi
Per altri esempi di codice da aggiungere alle mappe, vedere gli articoli seguenti: