Android SDK의 포인트 데이터 클러스터링
맵에서 많은 데이터 요소를 시각화하면 데이터 요소가 서로 겹칠 수 있습니다. 겹치는 경우 맵을 읽을 수 없게 되고 사용하기 어려울 수 있습니다. 지점 데이터 클러스터링은 서로 가까이 있는 지점 데이터를 결합하여 맵에 단일 클러스터형 데이터 요소로 표시하는 프로세스입니다. 사용자가 맵을 확대하면 클러스터는 개별 데이터 요소로 분리됩니다. 많은 수의 데이터 요소로 작업할 때 클러스터링 프로세스를 사용하여 사용자 환경을 개선합니다.
참고 항목
Azure Maps Android SDK 사용 중지
이제 Android용 Azure Maps 네이티브 SDK는 더 이상 사용되지 않으며 2025년 3월 31일에 사용 중지됩니다. 서비스 중단을 방지하려면 2025년 3월 31일까지 Azure Maps 웹 SDK로 마이그레이션합니다. 자세한 내용은 Azure Maps Android SDK 마이그레이션 가이드를 참조하세요.
필수 조건
빠른 시작: Android 앱 만들기 문서의 단계를 완료해야 합니다. 이 문서의 코드 블록은 맵 onReady 이벤트 처리기에 삽입할 수 있습니다.
데이터 원본에서 클러스터링 사용
cluster 옵션을 true로 설정하여 DataSource 클래스에서 클러스터링을 사용하도록 설정합니다. 주변 요소를 선택하여 클러스터로 결합하도록 clusterRadius를 설정합니다. clusterRadius의 값은 픽셀 단위입니다. clusterMaxZoom을 사용하여 클러스터링 논리를 사용하지 않도록 설정할 확대/축소 수준을 지정합니다. 데이터 원본에서 클러스터링을 사용하도록 설정하는 방법의 예는 다음과 같습니다.
//Create a data source and enable clustering.
DataSource source = new DataSource(
    //Tell the data source to cluster point data.
    cluster(true),

    //The radius in pixels to cluster points together.
    clusterRadius(45),

    //The maximum zoom level in which clustering occurs.
    //If you zoom in more than this, all points are rendered as symbols.
    clusterMaxZoom(15)
);
 //Create a data source and enable clustering.
val source = DataSource(
    //Tell the data source to cluster point data.
    cluster(true),

    //The radius in pixels to cluster points together.
    clusterRadius(45),

    //The maximum zoom level in which clustering occurs.
    //If you zoom in more than this, all points are rendered as symbols.
    clusterMaxZoom(15)
)
주의
클러스터링은 Point 기능에서만 작동합니다. 데이터 원본에 LineString 또는 Polygon과 같은 다른 도형 유형의 기능이 포함되어 있으면 오류가 발생합니다.
팁
두 데이터 요소를 함께 사용하는 경우 확대로 인해 데이터 요소가 얼마나 가까워지든, 클러스터는 절대 분리되지 않습니다. 이를 해결하기 위해 clusterMaxZoom 옵션을 설정하여 클러스터링 논리를 사용하지 않도록 설정하고 모든 항목을 표시하기만 합니다.
DataSource 클래스는 클러스터링과 관련하여 다음 메서드를 제공합니다.
| 메서드 | 반환 형식 | 설명 |
|---|---|---|
getClusterChildren(Feature clusterFeature) |
FeatureCollection |
다음 확대/축소 수준에서 지정된 클러스터의 자식 요소를 검색합니다. 이러한 자식 요소는 도형과 하위 클러스터의 조합일 수 있습니다. 하위 클러스터는 ClusteredProperties와 일치하는 속성이 있는 기능이 됩니다. |
getClusterExpansionZoom(Feature clusterFeature) |
int |
클러스터가 확장되거나 분리되기 시작하는 확대/축소 수준을 계산합니다. |
getClusterLeaves(Feature clusterFeature, long limit, long offset) |
FeatureCollection |
클러스터의 모든 지점을 검색합니다. limit를 설정하여 지점의 하위 세트를 반환하고, offset을 사용하여 지점을 통해 페이지를 이동합니다. |
거품형 계층을 사용하여 클러스터 표시
거품형 계층은 클러스터형 요소를 렌더링하는 좋은 방법입니다. 식을 사용하여 반지름의 크기를 조정하고 클러스터의 요소 수에 따라 색을 변경합니다. 거품형 계층을 사용하여 클러스터를 표시하는 경우에는 별도의 계층을 사용하여 비클러스터형 데이터 요소를 렌더링해야 합니다.
클러스터의 크기를 거품 위에 표시하려면 텍스트와 함께 기호 계층을 사용하고 아이콘은 사용하지 마세요.
다음 코드는 거품형 레이어를 사용하여 클러스터된 포인트를 표시하고 기호 레이어를 사용하여 각 클러스터의 포인트 수를 표시합니다. 두 번째 기호 레이어는 클러스터 내에 있지 않은 개별 포인트를 표시하는 데 사용됩니다.
//Create a data source and add it to the map.
DataSource source = new DataSource(
    //Tell the data source to cluster point data.
    cluster(true),

    //The radius in pixels to cluster points together.
    clusterRadius(45),

    //The maximum zoom level in which clustering occurs.
    //If you zoom in more than this, all points are rendered as symbols.
    clusterMaxZoom(15)
);

//Import the geojson data and add it to the data source.
map.importDataFromUrl("https://earthquake.usgs.gov/earthquakes/feed/v1.0/summary/all_week.geojson");

//Add data source to the map.
map.sources.add(source);

//Create a bubble layer for rendering clustered data points.
map.layers.add(new BubbleLayer(source,
    //Scale the size of the clustered bubble based on the number of points in the cluster.
    bubbleRadius(
        step(
            get("point_count"),
            20,             //Default of 20 pixel radius.
            stop(100, 30),  //If point_count >= 100, radius is 30 pixels.
            stop(750, 40)   //If point_count >= 750, radius is 40 pixels.
        )
    ),

    //Change the color of the cluster based on the value on the point_cluster property of the cluster.
    bubbleColor(
        step(
            toNumber(get("point_count")),
            color(Color.GREEN),              //Default to lime green.
            stop(100, color(Color.YELLOW)),  //If the point_count >= 100, color is yellow.
            stop(750, color(Color.RED))      //If the point_count >= 100, color is red.
        )
    ),

    bubbleStrokeWidth(0f),

    //Only rendered data points which have a point_count property, which clusters do.
    BubbleLayerOptions.filter(has("point_count"))
));

//Create a symbol layer to render the count of locations in a cluster.
map.layers.add(new SymbolLayer(source,
    iconImage("none"),                //Hide the icon image.
    textField(get("point_count")),    //Display the point count as text.
    textOffset(new Float[]{ 0f, 0.4f }),

    //Allow clustered points in this layer.
    SymbolLayerOptions.filter(has("point_count"))
));

//Create a layer to render the individual locations.
map.layers.add(new SymbolLayer(source,
    //Filter out clustered points from this layer.
    SymbolLayerOptions.filter(not(has("point_count")))
));
//Create a data source and add it to the map.
val source = DataSource(
    //Tell the data source to cluster point data.
    cluster(true),

    //The radius in pixels to cluster points together.
    clusterRadius(45),

    //The maximum zoom level in which clustering occurs.
    //If you zoom in more than this, all points are rendered as symbols.
    clusterMaxZoom(15)
)

//Import the geojson data and add it to the data source.
map.importDataFromUrl("https://earthquake.usgs.gov/earthquakes/feed/v1.0/summary/all_week.geojson")

//Add data source to the map.
map.sources.add(source)

//Create a bubble layer for rendering clustered data points.
map.layers.add(
    BubbleLayer(
        source,

        //Scale the size of the clustered bubble based on the number of points in the cluster.
        bubbleRadius(
            step(
                get("point_count"),
                20,  //Default of 20 pixel radius.
                stop(100, 30),  //If point_count >= 100, radius is 30 pixels.
                stop(750, 40) //If point_count >= 750, radius is 40 pixels.
            )
        ),

        //Change the color of the cluster based on the value on the point_cluster property of the cluster.
        bubbleColor(
            step(
                toNumber(get("point_count")),
                color(Color.GREEN),  //Default to lime green.
                stop(100, color(Color.YELLOW)),  //If the point_count >= 100, color is yellow.
                stop(750, color(Color.RED)) //If the point_count >= 100, color is red.
            )
        ),
        bubbleStrokeWidth(0f),

        //Only rendered data points which have a point_count property, which clusters do.
        BubbleLayerOptions.filter(has("point_count"))
    )
)

//Create a symbol layer to render the count of locations in a cluster.
map.layers.add(
    SymbolLayer(
        source,
        iconImage("none"),  //Hide the icon image.
        textField(get("point_count")),  //Display the point count as text.
        textOffset(arrayOf(0f, 0.4f)),

        //Allow clustered points in this layer.
        SymbolLayerOptions.filter(has("point_count"))
    )
)

//Create a layer to render the individual locations.
map.layers.add(
    SymbolLayer(
        source,

        //Filter out clustered points from this layer.
        SymbolLayerOptions.filter(not(has("point_count")))
    )
)
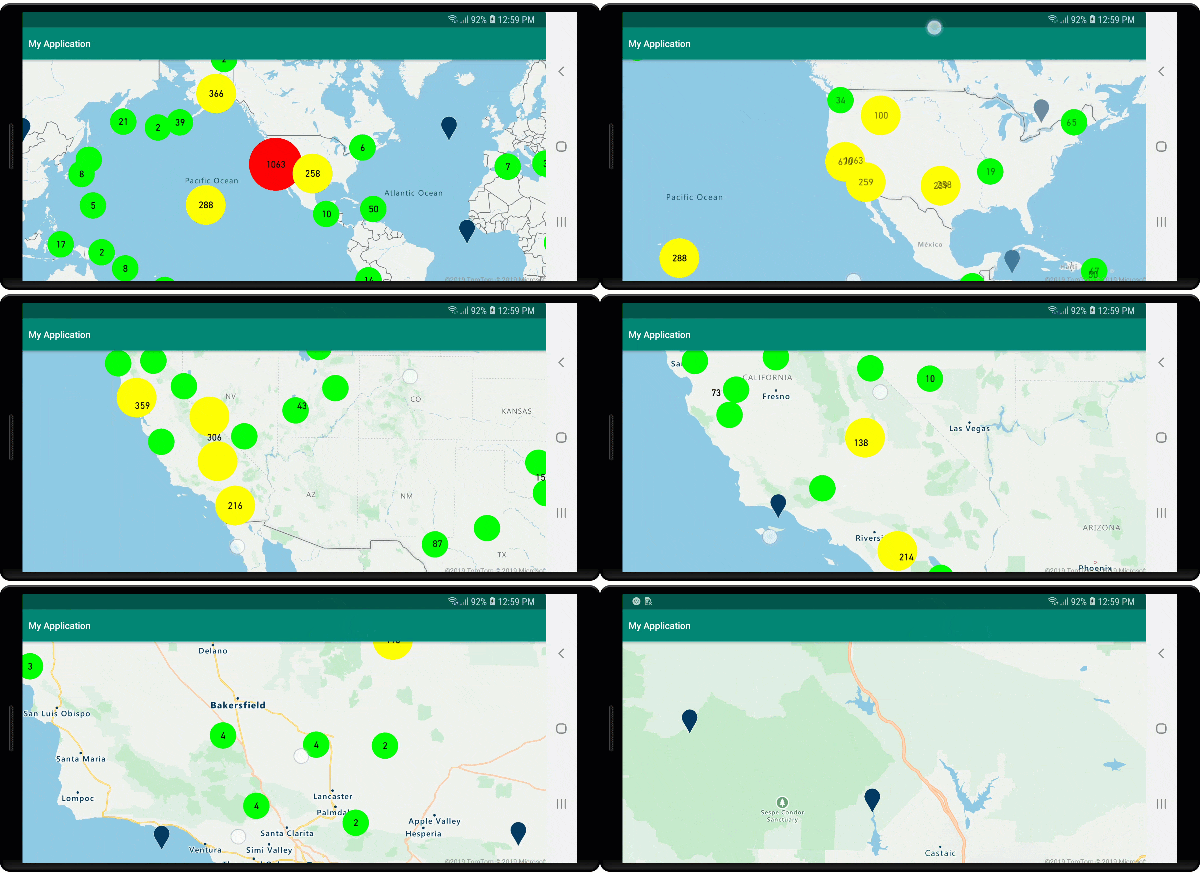
다음 이미지는 클러스터의 포인트 수에 따라 크기가 조정되고 색상이 지정된 거품형 레이어의 클러스터된 포인트 기능을 표시하는 위의 코드를 보여 줍니다. 클러스터되지 않은 포인트는 기호 레이어를 사용하여 렌더링됩니다.
기호 계층을 사용하여 클러스터 표시
데이터 요소를 시각화할 때 기호 계층은 보다 명확한 사용자 인터페이스를 위해 서로 겹치는 기호를 자동으로 숨깁니다. 맵에 데이터 요소 밀도를 표시하려는 경우 이 기본 동작은 바람직하지 않을 수 있습니다. 그러나 이러한 설정은 변경할 수 있습니다. 모든 기호를 표시하려면 기호 계층의 iconAllowOverlap 옵션을 true로 설정합니다.
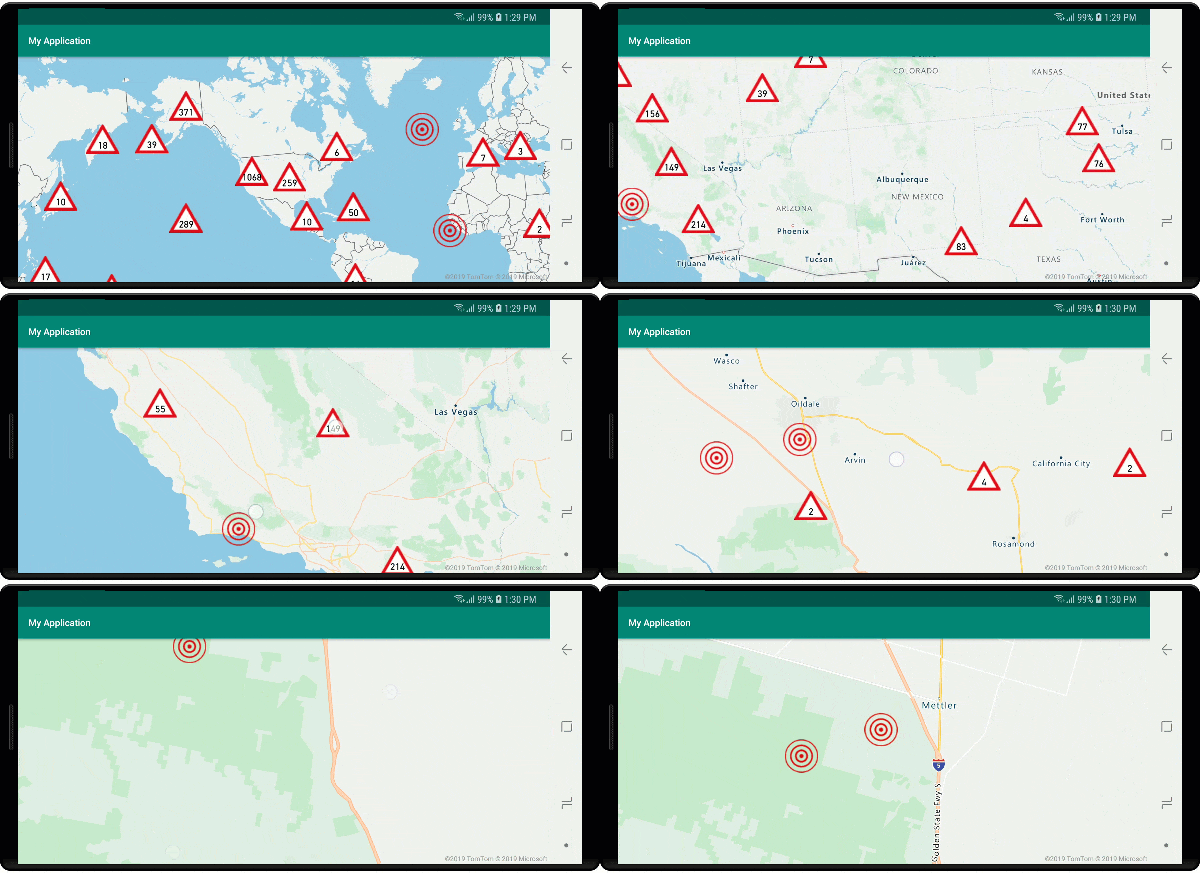
클러스터링을 사용하여 선명한 사용자 인터페이스를 유지하면서 데이터 요소 밀도를 표시합니다. 다음 샘플에서는 기호 계층을 사용하여 사용자 지정 기호를 추가하고 클러스터 및 개별 데이터 요소를 나타내는 방법을 보여 줍니다.
//Load all the custom image icons into the map resources.
map.images.add("earthquake_icon", R.drawable.earthquake_icon);
map.images.add("warning_triangle_icon", R.drawable.warning_triangle_icon);

//Create a data source and add it to the map.
DataSource source = new DataSource(
    //Tell the data source to cluster point data.
    cluster(true)
);

//Import the geojson data and add it to the data source.
map.importDataFromUrl("https://earthquake.usgs.gov/earthquakes/feed/v1.0/summary/all_week.geojson");

//Add data source to the map.
map.sources.add(source);

//Create a symbol layer to render the clusters.
map.layers.add(new SymbolLayer(source,
    iconImage("warning_triangle_icon"),
    textField(get("point_count")),
    textOffset(new Float[]{ 0f, -0.4f }),

    //Allow clustered points in this layer.
    filter(has("point_count"))
));

//Create a layer to render the individual locations.
map.layers.add(new SymbolLayer(source,
    iconImage("earthquake_icon"),

    //Filter out clustered points from this layer.
    filter(not(has("point_count")))
));
//Load all the custom image icons into the map resources.
map.images.add("earthquake_icon", R.drawable.earthquake_icon)
map.images.add("warning_triangle_icon", R.drawable.warning_triangle_icon)

//Create a data source and add it to the map.
val source = DataSource(
    //Tell the data source to cluster point data.
    cluster(true)
)

//Import the geojson data and add it to the data source.
map.importDataFromUrl("https://earthquake.usgs.gov/earthquakes/feed/v1.0/summary/all_week.geojson")

//Add data source to the map.
map.sources.add(source)

//Create a symbol layer to render the clusters.
map.layers.add(
    SymbolLayer(
        source,
        iconImage("warning_triangle_icon"),
        textField(get("point_count")),
        textOffset(arrayOf(0f, -0.4f)),

        //Allow clustered points in this layer.
        filter(has("point_count"))
    )
)

//Create a layer to render the individual locations.
map.layers.add(
    SymbolLayer(
        source,
        iconImage("earthquake_icon"),

        //Filter out clustered points from this layer.
        filter(not(has("point_count")))
    )
)
이 샘플의 경우 다음 이미지가 앱의 드로어블 폴더에 로드됩니다.
| earthquake_icon.png | warning_triangle_icon.png |
다음 이미지는 사용자 지정 아이콘을 사용하여 클러스터링된 포인트 기능과 클러스터링되지 않은 포인트 기능을 렌더링하는 위의 코드를 보여 줍니다.
클러스터링 및 열 지도 계층
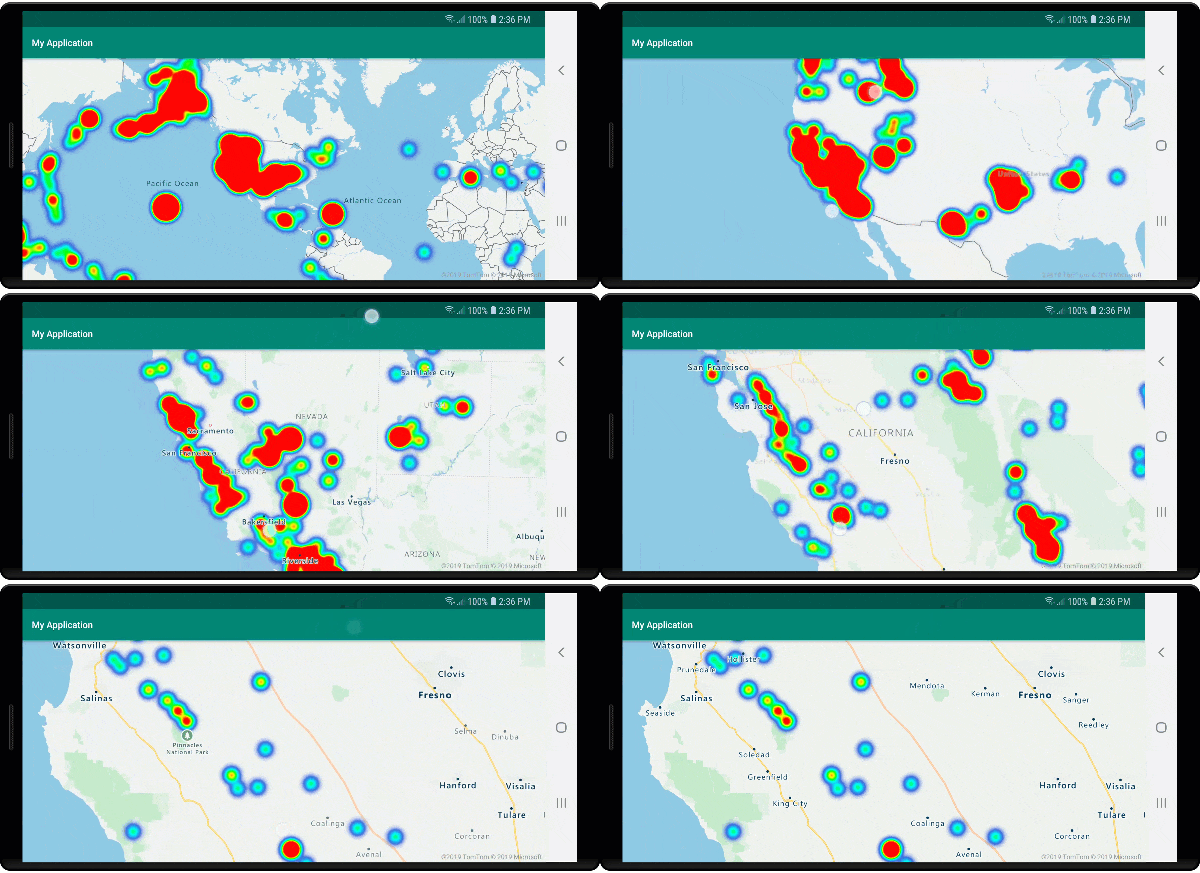
열 지도는 지도에 데이터 밀도를 표시하는 좋은 방법입니다. 이 시각화 메서드는 자체적으로 많은 수의 데이터 요소를 처리할 수 있습니다. 데이터 요소가 클러스터링되며 클러스터 크기가 열 지도의 가중치로 사용되면 열 지도에서 더 많은 데이터를 처리할 수 있습니다. 이 옵션을 구현하려면 열 지도 계층의 heatmapWeight 옵션을 get("point_count")로 설정합니다. 클러스터 반지름이 작은 경우 열 지도는 비클러스터형 데이터 요소를 사용하여 열 지도와 거의 동일하게 보이지만 더 나은 성능을 나타냅니다. 그러나 클러스터 반지름이 작을수록 열 지도가 더 정확하게 나타나지만 성능상의 이점이 줄어듭니다.
//Create a data source and add it to the map.
DataSource source = new DataSource(
    //Tell the data source to cluster point data.
    cluster(true),

    //The radius in pixels to cluster points together.
    clusterRadius(10)
);

//Import the geojson data and add it to the data source.
map.importDataFromUrl("https://earthquake.usgs.gov/earthquakes/feed/v1.0/summary/all_week.geojson");

//Add data source to the map.
map.sources.add(source);

//Create a heat map and add it to the map.
map.layers.add(new HeatMapLayer(source,
    //Set the weight to the point_count property of the data points.
    heatmapWeight(get("point_count")),

    //Optionally adjust the radius of each heat point.
    heatmapRadius(20f)
), "labels");
//Create a data source and add it to the map.
val source = DataSource(
    //Tell the data source to cluster point data.
    cluster(true),

    //The radius in pixels to cluster points together.
    clusterRadius(10)
)

//Import the geojson data and add it to the data source.
map.importDataFromUrl("https://earthquake.usgs.gov/earthquakes/feed/v1.0/summary/all_week.geojson")

//Add data source to the map.
map.sources.add(source)

//Create a heat map and add it to the map.
map.layers.add(
    HeatMapLayer(
        source,

        //Set the weight to the point_count property of the data points.
        heatmapWeight(get("point_count")),

        //Optionally adjust the radius of each heat point.
        heatmapRadius(20f)
    ), "labels"
)
다음 이미지는 위의 코드가 클러스터된 포인트 기능과 히트 맵의 가중치로 클러스터 수를 사용하여 최적화된 히트 맵을 표시하는 것을 보여 줍니다.
클러스터형 데이터 요소의 마우스 이벤트
클러스터형 데이터 요소를 포함하는 계층에서 마우스 이벤트가 발생하면 클러스터형 데이터 요소는 이벤트를 GeoJSON 요소 기능 개체로 반환합니다. 이 요소 기능에는 다음과 같은 속성이 있습니다.
| Property name | 형식 | 설명 |
|---|---|---|
cluster |
부울 값 | 기능이 클러스터를 표시하는지 여부를 나타냅니다. |
point_count |
number | 클러스터에 포함된 지점의 수입니다. |
point_count |
number | 클러스터에 포함된 지점의 수입니다. |
point_count_abbreviated |
string | 길이가 긴 경우 point_count 값을 줄여서 표시하는 문자열입니다. (예: 4,000은 4K) |
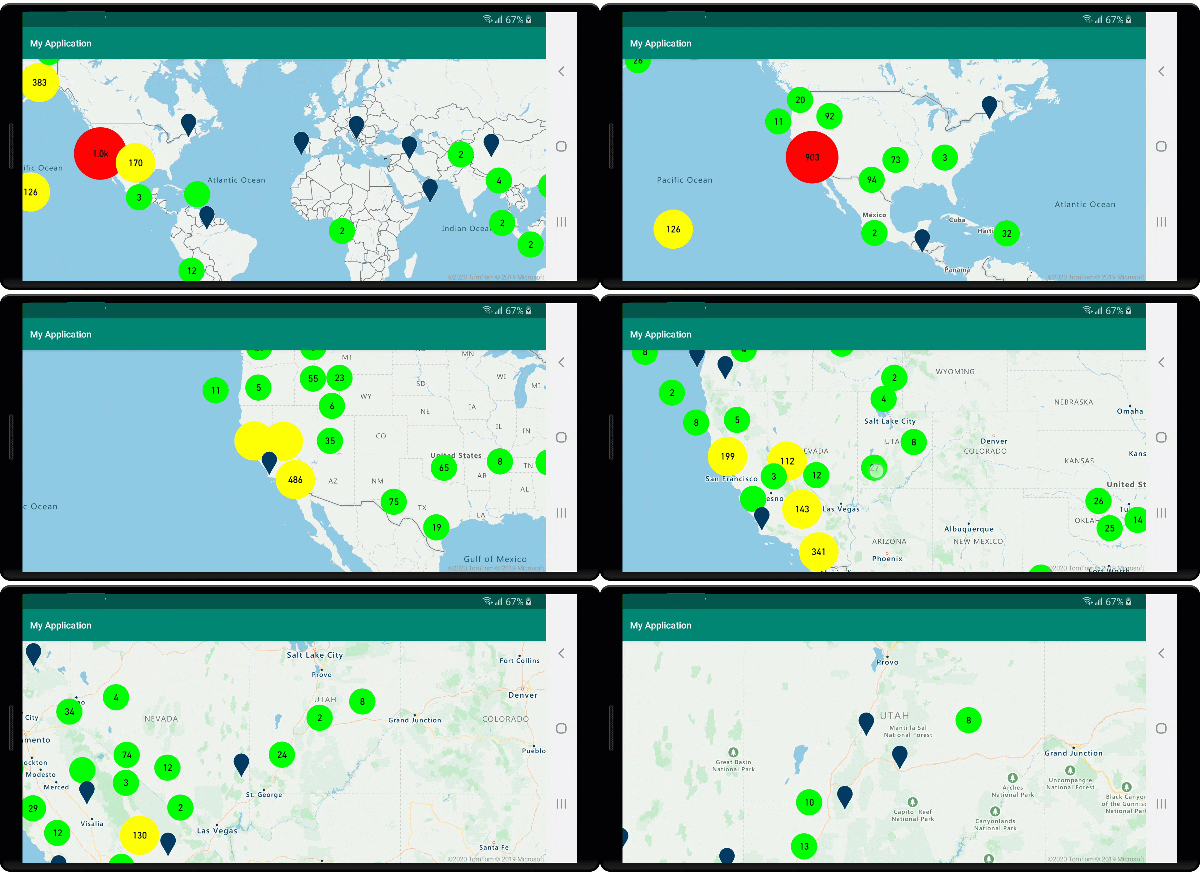
이 예제에서는 클러스터 요소를 렌더링하고 클릭 이벤트를 추가하는 거품형 계층을 사용합니다. 클릭 이벤트가 트리거되면 이 코드는 맵을 계산하고 다음 확대/축소 수준으로 확대/축소하여 클러스터를 분리합니다. 이 기능은 DataSource 클래스의 getClusterExpansionZoom 메서드와 클릭한 클러스터형 데이터 요소의 cluster_id 속성을 사용하여 구현됩니다.
//Create a data source and add it to the map.
DataSource source = new DataSource(
    //Tell the data source to cluster point data.
    cluster(true),

    //The radius in pixels to cluster points together.
    clusterRadius(45),

    //The maximum zoom level in which clustering occurs.
    //If you zoom in more than this, all points are rendered as symbols.
    clusterMaxZoom(15)
);

//Import the geojson data and add it to the data source.
source.importDataFromUrl("https://earthquake.usgs.gov/earthquakes/feed/v1.0/summary/all_week.geojson");

//Add data source to the map.
map.sources.add(source);

//Create a bubble layer for rendering clustered data points.
BubbleLayer clusterBubbleLayer = new BubbleLayer(source,
    //Scale the size of the clustered bubble based on the number of points in the cluster.
    bubbleRadius(
        step(
            get("point_count"),
            20f,    //Default of 20 pixel radius.
            stop(100, 30),   //If point_count >= 100, radius is 30 pixels.
            stop(750, 40)    //If point_count >= 750, radius is 40 pixels.
        )
    ),

    //Change the color of the cluster based on the value on the point_cluster property of the cluster.
    bubbleColor(
        step(
            get("point_count"),
            color(Color.GREEN),  //Default to green.
            stop(100, color(Color.YELLOW)), //If the point_count >= 100, color is yellow.
            stop(750, color(Color.RED))     //If the point_count >= 100, color is red.
        )
    ),

    bubbleStrokeWidth(0f),

    //Only rendered data points which have a point_count property, which clusters do.
    BubbleLayerOptions.filter(has("point_count"))
);

//Add the clusterBubbleLayer and two additional layers to the map.
map.layers.add(clusterBubbleLayer);

//Create a symbol layer to render the count of locations in a cluster.
map.layers.add(new SymbolLayer(source,
    //Hide the icon image.
    iconImage("none"),

    //Display the 'point_count_abbreviated' property value.
    textField(get("point_count_abbreviated")),

    //Offset the text position so that it's centered nicely.
    textOffset(new Float[] { 0f, 0.4f }),

    //Only rendered data points which have a point_count property, which clusters do.
    SymbolLayerOptions.filter(has("point_count"))
));

//Create a layer to render the individual locations.
map.layers.add(new SymbolLayer(source,
    //Filter out clustered points from this layer.
    SymbolLayerOptions.filter(not(has("point_count")))
));

//Add a click event to the cluster layer so we can zoom in when a user clicks a cluster.
map.events.add((OnFeatureClick) (features) -> {
    if(features.size() > 0) {
        //Get the clustered point from the event.
        Feature cluster = features.get(0);

        //Get the cluster expansion zoom level. This is the zoom level at which the cluster starts to break apart.
        int expansionZoom = source.getClusterExpansionZoom(cluster);

        //Update the map camera to be centered over the cluster.
        map.setCamera(
            //Center the map over the cluster points location.
            center((Point)cluster.geometry()),

            //Zoom to the clusters expansion zoom level.
            zoom(expansionZoom),

            //Animate the movement of the camera to the new position.
            animationType(AnimationType.EASE),
            animationDuration(200)
        );
    }

    //Return true indicating if event should be consumed and not passed further to other listeners registered afterwards, false otherwise.
    return true;
}, clusterBubbleLayer);
//Create a data source and add it to the map.
val source = DataSource( //Tell the data source to cluster point data.
    //The radius in pixels to cluster points together.
    cluster(true),

    //The maximum zoom level in which clustering occurs.
    clusterRadius(45),

    //If you zoom in more than this, all points are rendered as symbols.
    clusterMaxZoom(15)
)

//Import the geojson data and add it to the data source.
source.importDataFromUrl("https://earthquake.usgs.gov/earthquakes/feed/v1.0/summary/all_week.geojson")

//Add data source to the map.
map.sources.add(source)

//Create a bubble layer for rendering clustered data points.
val clusterBubbleLayer = BubbleLayer(
    source,

    //Scale the size of the clustered bubble based on the number of points in the cluster.
    bubbleRadius(
        step(
            get("point_count"),
            20f,  //Default of 20 pixel radius.
            stop(100, 30),  //If point_count >= 100, radius is 30 pixels.
            stop(750, 40) //If point_count >= 750, radius is 40 pixels.
        )
    ),

    //Change the color of the cluster based on the value on the point_cluster property of the cluster.
    bubbleColor(
        step(
            get("point_count"),
            color(Color.GREEN),  //Default to green.
            stop(
                100,
                color(Color.YELLOW)
            ),  //If the point_count >= 100, color is yellow.
            stop(750, color(Color.RED)) //If the point_count >= 100, color is red.
        )
    ),

    bubbleStrokeWidth(0f),

    //Only rendered data points which have a point_count property, which clusters do.
    BubbleLayerOptions.filter(has("point_count"))
)

//Add the clusterBubbleLayer and two additional layers to the map.
map.layers.add(clusterBubbleLayer)

//Create a symbol layer to render the count of locations in a cluster.
map.layers.add(
    SymbolLayer(
        source,

        //Hide the icon image.
        iconImage("none"),

        //Display the 'point_count_abbreviated' property value.
        textField(get("point_count_abbreviated")),

        //Offset the text position so that it's centered nicely.
        textOffset(
            arrayOf(
                0f,
                0.4f
            )
        ),

        //Only rendered data points which have a point_count property, which clusters do.
        SymbolLayerOptions.filter(has("point_count"))
    )
)

//Create a layer to render the individual locations.
map.layers.add(
    SymbolLayer(
        source,

        //Filter out clustered points from this layer.
        SymbolLayerOptions.filter(not(has("point_count")))
    )
)

//Add a click event to the cluster layer so we can zoom in when a user clicks a cluster.
map.events.add(OnFeatureClick { features: List<Feature?>? ->
    if (features.size() > 0) {
        //Get the clustered point from the event.
        val cluster: Feature = features.get(0)

        //Get the cluster expansion zoom level. This is the zoom level at which the cluster starts to break apart.
        val expansionZoom: Int = source.getClusterExpansionZoom(cluster)

        //Update the map camera to be centered over the cluster.
        map.setCamera(

            //Center the map over the cluster points location.
            center(cluster.geometry() as Point?),

            //Zoom to the clusters expansion zoom level.
            zoom(expansionZoom),

            //Animate the movement of the camera to the new position.
            animationType(AnimationType.EASE),
            animationDuration(200)
        )
    }
    true
}, clusterBubbleLayer)
다음 이미지는 위의 코드가 맵에 클러스터된 포인트를 표시하는 것을 보여 줍니다. 선택하면 클러스터가 분리되고 확장되기 시작하는 다음 확대/축소 수준으로 확대됩니다.
클러스터 영역 표시
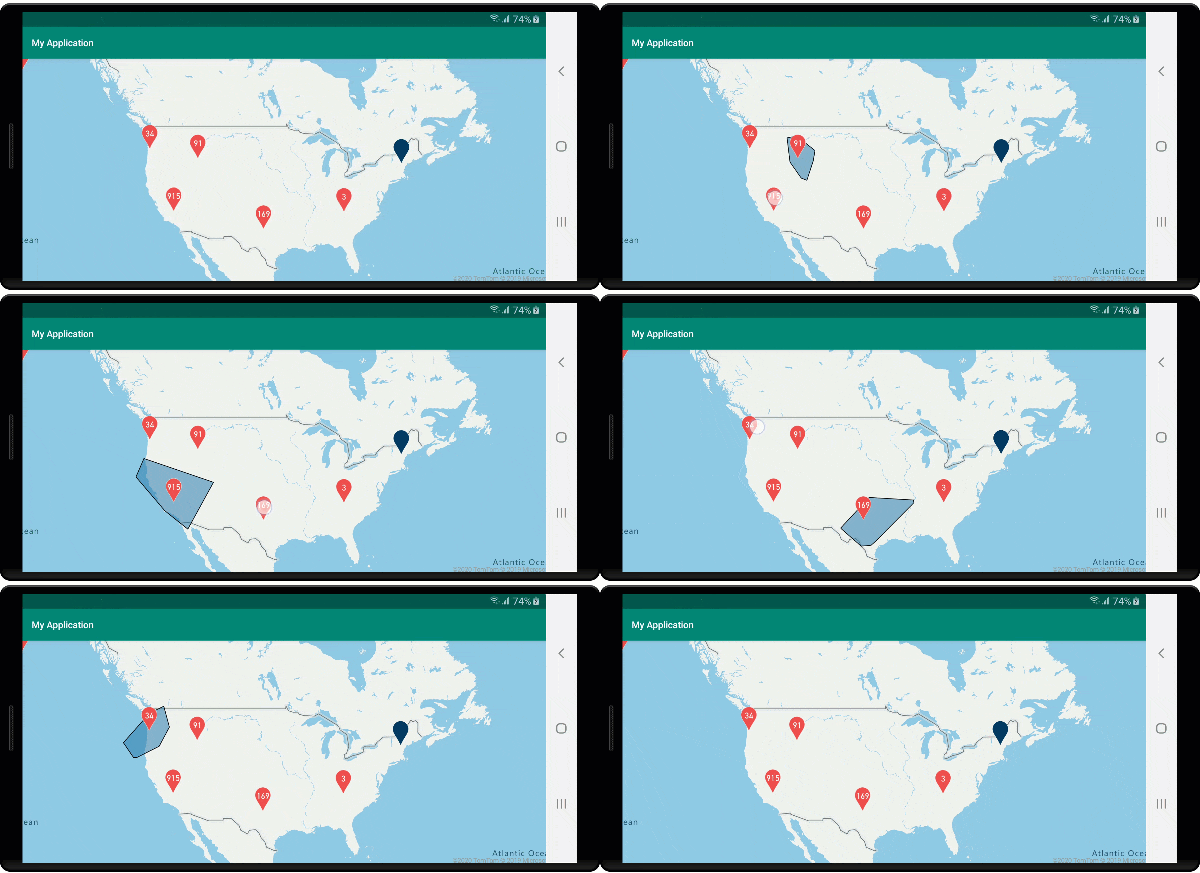
클러스터가 나타내는 요소 데이터는 영역에 분산됩니다. 이 샘플에서는 마우스로 클러스터를 가리킬 때 두 가지 주요 동작이 발생합니다. 먼저 클러스터에 포함된 개별 데이터 요소를 사용하여 볼록 집합(convex hull)을 계산합니다. 그러면 볼록 집합이 맵에 표시되면서 영역을 표시합니다. 볼록 집합은 탄력적 밴드와 같은 일련의 요소를 래핑하고 atlas.math.getConvexHull 메서드를 사용하여 계산할 수 있는 다각형입니다. 클러스터에 포함된 모든 요소는 getClusterLeaves 메서드를 사용하여 데이터 원본에서 검색할 수 있습니다.
//Create a data source and add it to the map.
DataSource source = new DataSource(
    //Tell the data source to cluster point data.
    cluster(true)
);

//Import the geojson data and add it to the data source.
source.importDataFromUrl("https://earthquake.usgs.gov/earthquakes/feed/v1.0/summary/all_week.geojson");

//Add data source to the map.
map.sources.add(source);

//Create a data source for the convex hull polygon. Since this will be updated frequently it is more efficient to separate this into its own data source.
DataSource polygonDataSource = new DataSource();

//Add data source to the map.
map.sources.add(polygonDataSource);

//Add a polygon layer and a line layer to display the convex hull.
map.layers.add(new PolygonLayer(polygonDataSource));
map.layers.add(new LineLayer(polygonDataSource));

//Create a symbol layer to render the clusters.
SymbolLayer clusterLayer = new SymbolLayer(source,
    iconImage("marker-red"),
    textField(get("point_count_abbreviated")),
    textOffset(new Float[] { 0f, -1.2f }),
    textColor(Color.WHITE),
    textSize(14f),

    //Only rendered data points which have a point_count property, which clusters do.
    SymbolLayerOptions.filter(has("point_count"))
);
map.layers.add(clusterLayer);

//Create a layer to render the individual locations.
map.layers.add(new SymbolLayer(source,
    //Filter out clustered points from this layer.
    SymbolLayerOptions.filter(not(has("point_count")))
));

//Add a click event to the layer so we can calculate the convex hull of all the points within a cluster.
map.events.add((OnFeatureClick) (features) -> {
    if(features.size() > 0) {
        //Get the clustered point from the event.
        Feature cluster = features.get(0);

        //Get all points in the cluster. Set the offset to 0 and the max long value to return all points.
        FeatureCollection leaves = source.getClusterLeaves(cluster, Long.MAX_VALUE, 0);

        //Get the point features from the feature collection.
        List<Feature> childFeatures = leaves.features();

        //When only two points in a cluster. Render a line.
        if(childFeatures.size() == 2){
            //Extract the geometry points from the child features.
            List<Point> points = new ArrayList();

            childFeatures.forEach(f -> {
                points.add((Point)f.geometry());
            });

            //Create a line from the points.
            polygonDataSource.setShapes(LineString.fromLngLats(points));
        } else {
            Polygon hullPolygon = MapMath.getConvexHull(leaves);

            //Overwrite all data in the polygon data source with the newly calculated convex hull polygon.
            polygonDataSource.setShapes(hullPolygon);
        }
    }

    //Return true indicating if event should be consumed and not passed further to other listeners registered afterwards, false otherwise.
    return true;
}, clusterLayer);
//Create a data source and add it to the map.
val source = DataSource(
    //Tell the data source to cluster point data.
    cluster(true)
)

//Import the geojson data and add it to the data source.
source.importDataFromUrl("https://earthquake.usgs.gov/earthquakes/feed/v1.0/summary/all_week.geojson")

//Add data source to the map.
map.sources.add(source)

//Create a data source for the convex hull polygon. Since this will be updated frequently it is more efficient to separate this into its own data source.
val polygonDataSource = DataSource()

//Add data source to the map.
map.sources.add(polygonDataSource)

//Add a polygon layer and a line layer to display the convex hull.
map.layers.add(PolygonLayer(polygonDataSource))
map.layers.add(LineLayer(polygonDataSource))

//Create a symbol layer to render the clusters.
val clusterLayer = SymbolLayer(
    source,
    iconImage("marker-red"),
    textField(get("point_count_abbreviated")),
    textOffset(arrayOf(0f, -1.2f)),
    textColor(Color.WHITE),
    textSize(14f),

    //Only rendered data points which have a point_count property, which clusters do.
    SymbolLayerOptions.filter(has("point_count"))
)
map.layers.add(clusterLayer)

//Create a layer to render the individual locations.
map.layers.add(
    SymbolLayer(
        source,

        //Filter out clustered points from this layer.
        SymbolLayerOptions.filter(not(has("point_count")))
    )
)

//Add a click event to the layer so we can calculate the convex hull of all the points within a cluster.
map.events.add(OnFeatureClick { features: List<Feature?>? ->
    if (features.size() > 0) {
        //Get the clustered point from the event.
        val cluster: Feature = features.get(0)

        //Get all points in the cluster. Set the offset to 0 and the max long value to return all points.
        val leaves: FeatureCollection = source.getClusterLeaves(cluster, Long.MAX_VALUE, 0)

        //Get the point features from the feature collection.
        val childFeatures = leaves.features()

        //When only two points in a cluster. Render a line.
        if (childFeatures!!.size == 2) {
            //Extract the geometry points from the child features.
            val points: MutableList<Point?> = ArrayList()
            childFeatures!!.forEach(Consumer { f: Feature ->
                points.add(
                    f.geometry() as Point?
                )
            })

            //Create a line from the points.
            polygonDataSource.setShapes(LineString.fromLngLats(points))
        } else {
            val hullPolygon: Polygon = MapMath.getConvexHull(leaves)

            //Overwrite all data in the polygon data source with the newly calculated convex hull polygon.
            polygonDataSource.setShapes(hullPolygon)
        }
    }
    true
}, clusterLayer)
다음 이미지는 위의 코드가 클릭된 클러스터 내의 모든 포인트 영역을 표시하는 것을 보여 줍니다.
클러스터의 데이터 집계
클러스터는 종종 클러스터에 포함된 요소 수와 함께 기호를 사용하여 표시됩니다. 그러나 경우에 따라 추가 메트릭을 사용하여 클러스터 스타일을 사용자 지정하는 것이 좋습니다. 클러스터 속성을 사용하면 클러스터가 있는 각 포인트 내의 속성을 기반으로 한 계산과 동일한 사용자 지정 속성을 만들 수 있습니다. 클러스터 속성은 DataSource의 clusterProperties 옵션에서 정의할 수 있습니다.
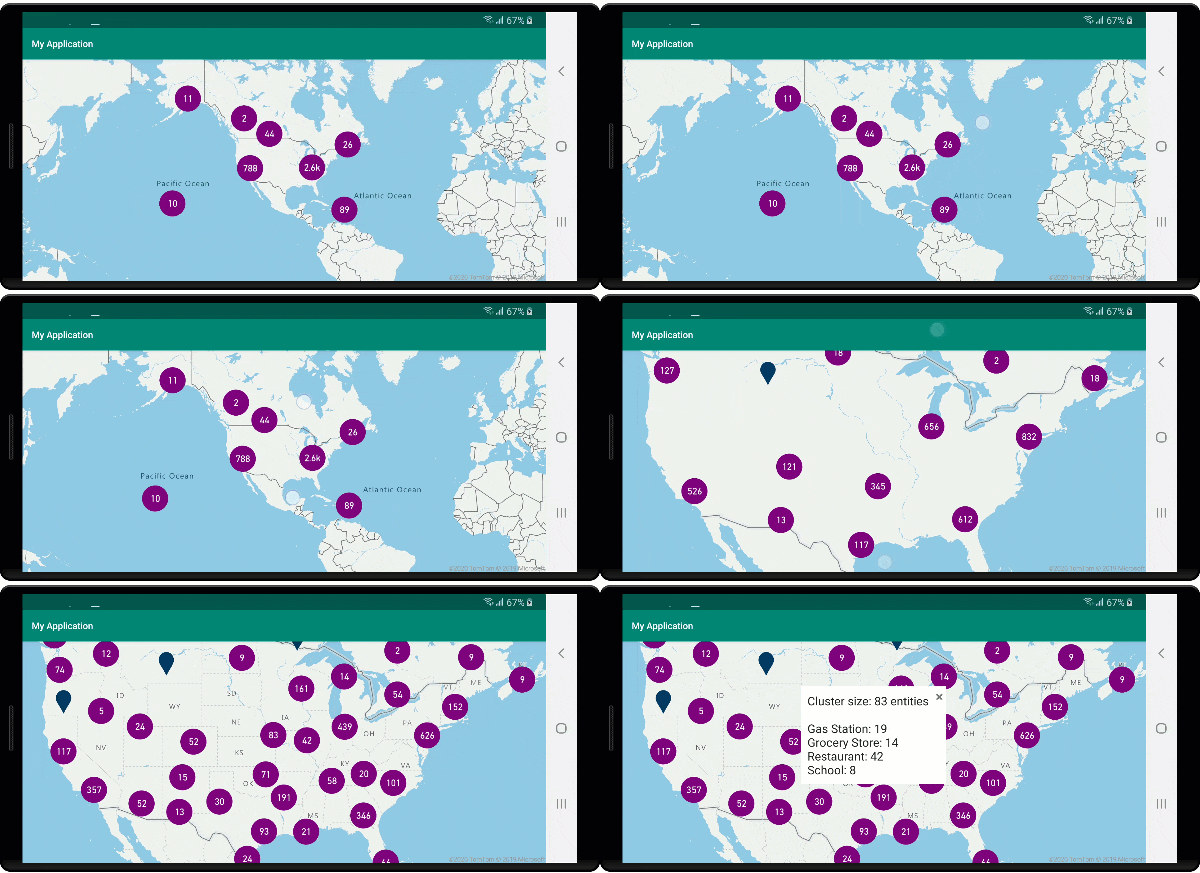
다음 코드는 클러스터에 있는 각 데이터 요소의 엔터티 형식 속성을 기준으로 개수를 계산합니다. 사용자가 클러스터를 선택하면 클러스터에 대한 추가 정보가 포함된 팝업이 표시됩니다.
//An array of all entity type property names in features of the data set.
String[] entityTypes = new String[] { "Gas Station", "Grocery Store", "Restaurant", "School" };

//Create a popup and add it to the map.
Popup popup = new Popup();
map.popups.add(popup);

//Close the popup initially.
popup.close();

//Create a data source and add it to the map.
source = new DataSource(
    //Tell the data source to cluster point data.
    cluster(true),

    //The radius in pixels to cluster points together.
    clusterRadius(50),

    //Calculate counts for each entity type in a cluster as custom aggregate properties.
    clusterProperties(new ClusterProperty[]{
        new ClusterProperty("Gas Station", sum(accumulated(), get("Gas Station")), switchCase(eq(get("EntityType"), literal("Gas Station")), literal(1), literal(0))),
        new ClusterProperty("Grocery Store", sum(accumulated(), get("Grocery Store")), switchCase(eq(get("EntityType"), literal("Grocery Store")), literal(1), literal(0))),
        new ClusterProperty("Restaurant", sum(accumulated(), get("Restaurant")), switchCase(eq(get("EntityType"), literal("Restaurant")), literal(1), literal(0))),
        new ClusterProperty("School", sum(accumulated(), get("School")), switchCase(eq(get("EntityType"), literal("School")), literal(1), literal(0)))
    })
);

//Import the geojson data and add it to the data source.
source.importDataFromUrl("https://samples.azuremaps.com/data/geojson/SamplePoiDataSet.json");

//Add data source to the map.
map.sources.add(source);

//Create a bubble layer for rendering clustered data points.
BubbleLayer clusterBubbleLayer = new BubbleLayer(source,
    bubbleRadius(20f),
    bubbleColor("purple"),
    bubbleStrokeWidth(0f),

    //Only rendered data points which have a point_count property, which clusters do.
    BubbleLayerOptions.filter(has("point_count"))
);

//Add the clusterBubbleLayer and two additional layers to the map.
map.layers.add(clusterBubbleLayer);

//Create a symbol layer to render the count of locations in a cluster.
map.layers.add(new SymbolLayer(source,
    //Hide the icon image.
    iconImage("none"),

    //Display the 'point_count_abbreviated' property value.
    textField(get("point_count_abbreviated")),

    textColor(Color.WHITE),
    textOffset(new Float[] { 0f, 0.4f }),

    //Only rendered data points which have a point_count property, which clusters do.
    SymbolLayerOptions.filter(has("point_count"))
));

//Create a layer to render the individual locations.
map.layers.add(new SymbolLayer(source,
    //Filter out clustered points from this layer.
    SymbolLayerOptions.filter(not(has("point_count")))
));

//Add a click event to the cluster layer and display the aggregate details of the cluster.
map.events.add((OnFeatureClick) (features) -> {
    if(features.size() > 0) {
        //Get the clustered point from the event.
        Feature cluster = features.get(0);

        //Create a number formatter that removes decimal places.
        NumberFormat nf = DecimalFormat.getInstance();
        nf.setMaximumFractionDigits(0);

        //Create the popup's content.
        StringBuilder sb = new StringBuilder();

        sb.append("Cluster size: ");
        sb.append(nf.format(cluster.getNumberProperty("point_count")));
        sb.append(" entities\n");

        for(int i = 0; i < entityTypes.length; i++) {
            sb.append("\n");

            //Get the entity type name.
            sb.append(entityTypes[i]);
            sb.append(": ");

            //Get the aggregated entity type count from the properties of the cluster by name.
            sb.append(nf.format(cluster.getNumberProperty(entityTypes[i])));
        }

        //Retrieve the custom layout for the popup.
        View customView = LayoutInflater.from(this).inflate(R.layout.popup_text, null);

        //Access the text view within the custom view and set the text to the title property of the feature.
        TextView tv = customView.findViewById(R.id.message);
        tv.setText(sb.toString());

        //Get the position of the cluster.
        Position pos = MapMath.getPosition((Point)cluster.geometry());

        //Set the options on the popup.
        popup.setOptions(
            //Set the popups position.
            position(pos),

            //Set the anchor point of the popup content.
            anchor(AnchorType.BOTTOM),

            //Set the content of the popup.
            content(customView)
        );

        //Open the popup.
        popup.open();
    }

    //Return a boolean indicating if event should be consumed or continue bubble up.
    return true;
}, clusterBubbleLayer);
//An array of all entity type property names in features of the data set.
val entityTypes = arrayOf("Gas Station", "Grocery Store", "Restaurant", "School")

//Create a popup and add it to the map.
val popup = Popup()
map.popups.add(popup)

//Close the popup initially.
popup.close()

//Create a data source and add it to the map.
val source = DataSource(
    //Tell the data source to cluster point data.
    cluster(true),

    //The radius in pixels to cluster points together.
    clusterRadius(50),

    //Calculate counts for each entity type in a cluster as custom aggregate properties.
    clusterProperties(
        arrayOf<ClusterProperty>(
            ClusterProperty("Gas Station", sum(accumulated(), get("Gas Station")), switchCase(eq(get("EntityType"), literal("Gas Station")), literal(1), literal(0))),
            ClusterProperty("Grocery Store", sum(accumulated(), get("Grocery Store")), switchCase(eq(get("EntityType"), literal("Grocery Store")), literal(1), literal(0))),
            ClusterProperty("Restaurant", sum(accumulated(), get("Restaurant")), switchCase(eq(get("EntityType"), literal("Restaurant")), literal(1), literal(0))),
            ClusterProperty("School", sum(accumulated(), get("School")), switchCase(eq(get("EntityType"), literal("School")), literal(1), literal(0)))
        )
    )
)

//Import the geojson data and add it to the data source.
source.importDataFromUrl("https://samples.azuremaps.com/data/geojson/SamplePoiDataSet.json")

//Add data source to the map.
map.sources.add(source)

//Create a bubble layer for rendering clustered data points.
val clusterBubbleLayer = BubbleLayer(
    source,
    bubbleRadius(20f),
    bubbleColor("purple"),
    bubbleStrokeWidth(0f),

    //Only rendered data points which have a point_count property, which clusters do.
    BubbleLayerOptions.filter(has("point_count"))
)

//Add the clusterBubbleLayer and two additional layers to the map.
map.layers.add(clusterBubbleLayer)

//Create a symbol layer to render the count of locations in a cluster.
map.layers.add(
    SymbolLayer(
        source,

        //Hide the icon image.
        iconImage("none"),

        //Display the 'point_count_abbreviated' property value.
        textField(get("point_count_abbreviated")),

        textColor(Color.WHITE),
        textOffset(arrayOf(0f, 0.4f)),

        //Only rendered data points which have a point_count property, which clusters do.
        SymbolLayerOptions.filter(has("point_count"))
    )
)

//Create a layer to render the individual locations.
map.layers.add(
    SymbolLayer(
        source,

        //Filter out clustered points from this layer.
        SymbolLayerOptions.filter(not(has("point_count")))
    )
)

//Add a click event to the cluster layer and display the aggregate details of the cluster.
map.events.add(OnFeatureClick { features: List<Feature> ->
    if (features.size > 0) {
        //Get the clustered point from the event.
        val cluster = features[0]

        //Create a number formatter that removes decimal places.
        val nf: NumberFormat = DecimalFormat.getInstance()
        nf.setMaximumFractionDigits(0)

        //Create the popup's content.
        val sb = StringBuilder()

        sb.append("Cluster size: ")
        sb.append(nf.format(cluster.getNumberProperty("point_count")))
        sb.append(" entities\n")

        for (i in entityTypes.indices) {
            sb.append("\n")

            //Get the entity type name.
            sb.append(entityTypes[i])
            sb.append(": ")

            //Get the aggregated entity type count from the properties of the cluster by name.
            sb.append(nf.format(cluster.getNumberProperty(entityTypes[i])))
        }

        //Retrieve the custom layout for the popup.
        val customView: View = LayoutInflater.from(this).inflate(R.layout.popup_text, null)

        //Access the text view within the custom view and set the text to the title property of the feature.
        val tv: TextView = customView.findViewById(R.id.message)
        tv.text = sb.toString()

        //Get the position of the cluster.
        val pos: Position = MapMath.getPosition(cluster.geometry() as Point?)

        //Set the options on the popup.
        popup.setOptions(
            //Set the popups position.
            position(pos),

            //Set the anchor point of the popup content.
            anchor(AnchorType.BOTTOM),

            //Set the content of the popup.
            content(customView)
        )

        //Open the popup.
        popup.open()
    }

    //Return a boolean indicating if event should be consumed or continue bubble up.
    true
} as OnFeatureClick, clusterBubbleLayer)
팝업은 팝업 표시 문서에 설명된 단계를 따릅니다.
다음 이미지는 위의 코드가 클릭된 클러스터링 포인트의 모든 포인트에 대한 각 엔터티 값 형식의 집계 개수가 있는 팝업을 표시하는 것을 보여 줍니다.
다음 단계
원본에 더 많은 데이터 추가: