How to monitor the quality of your agent on production traffic
Important
This feature is in Public Preview.
This article describes how to monitor the quality of deployed agents on production traffic using Mosaic AI Agent Evaluation.
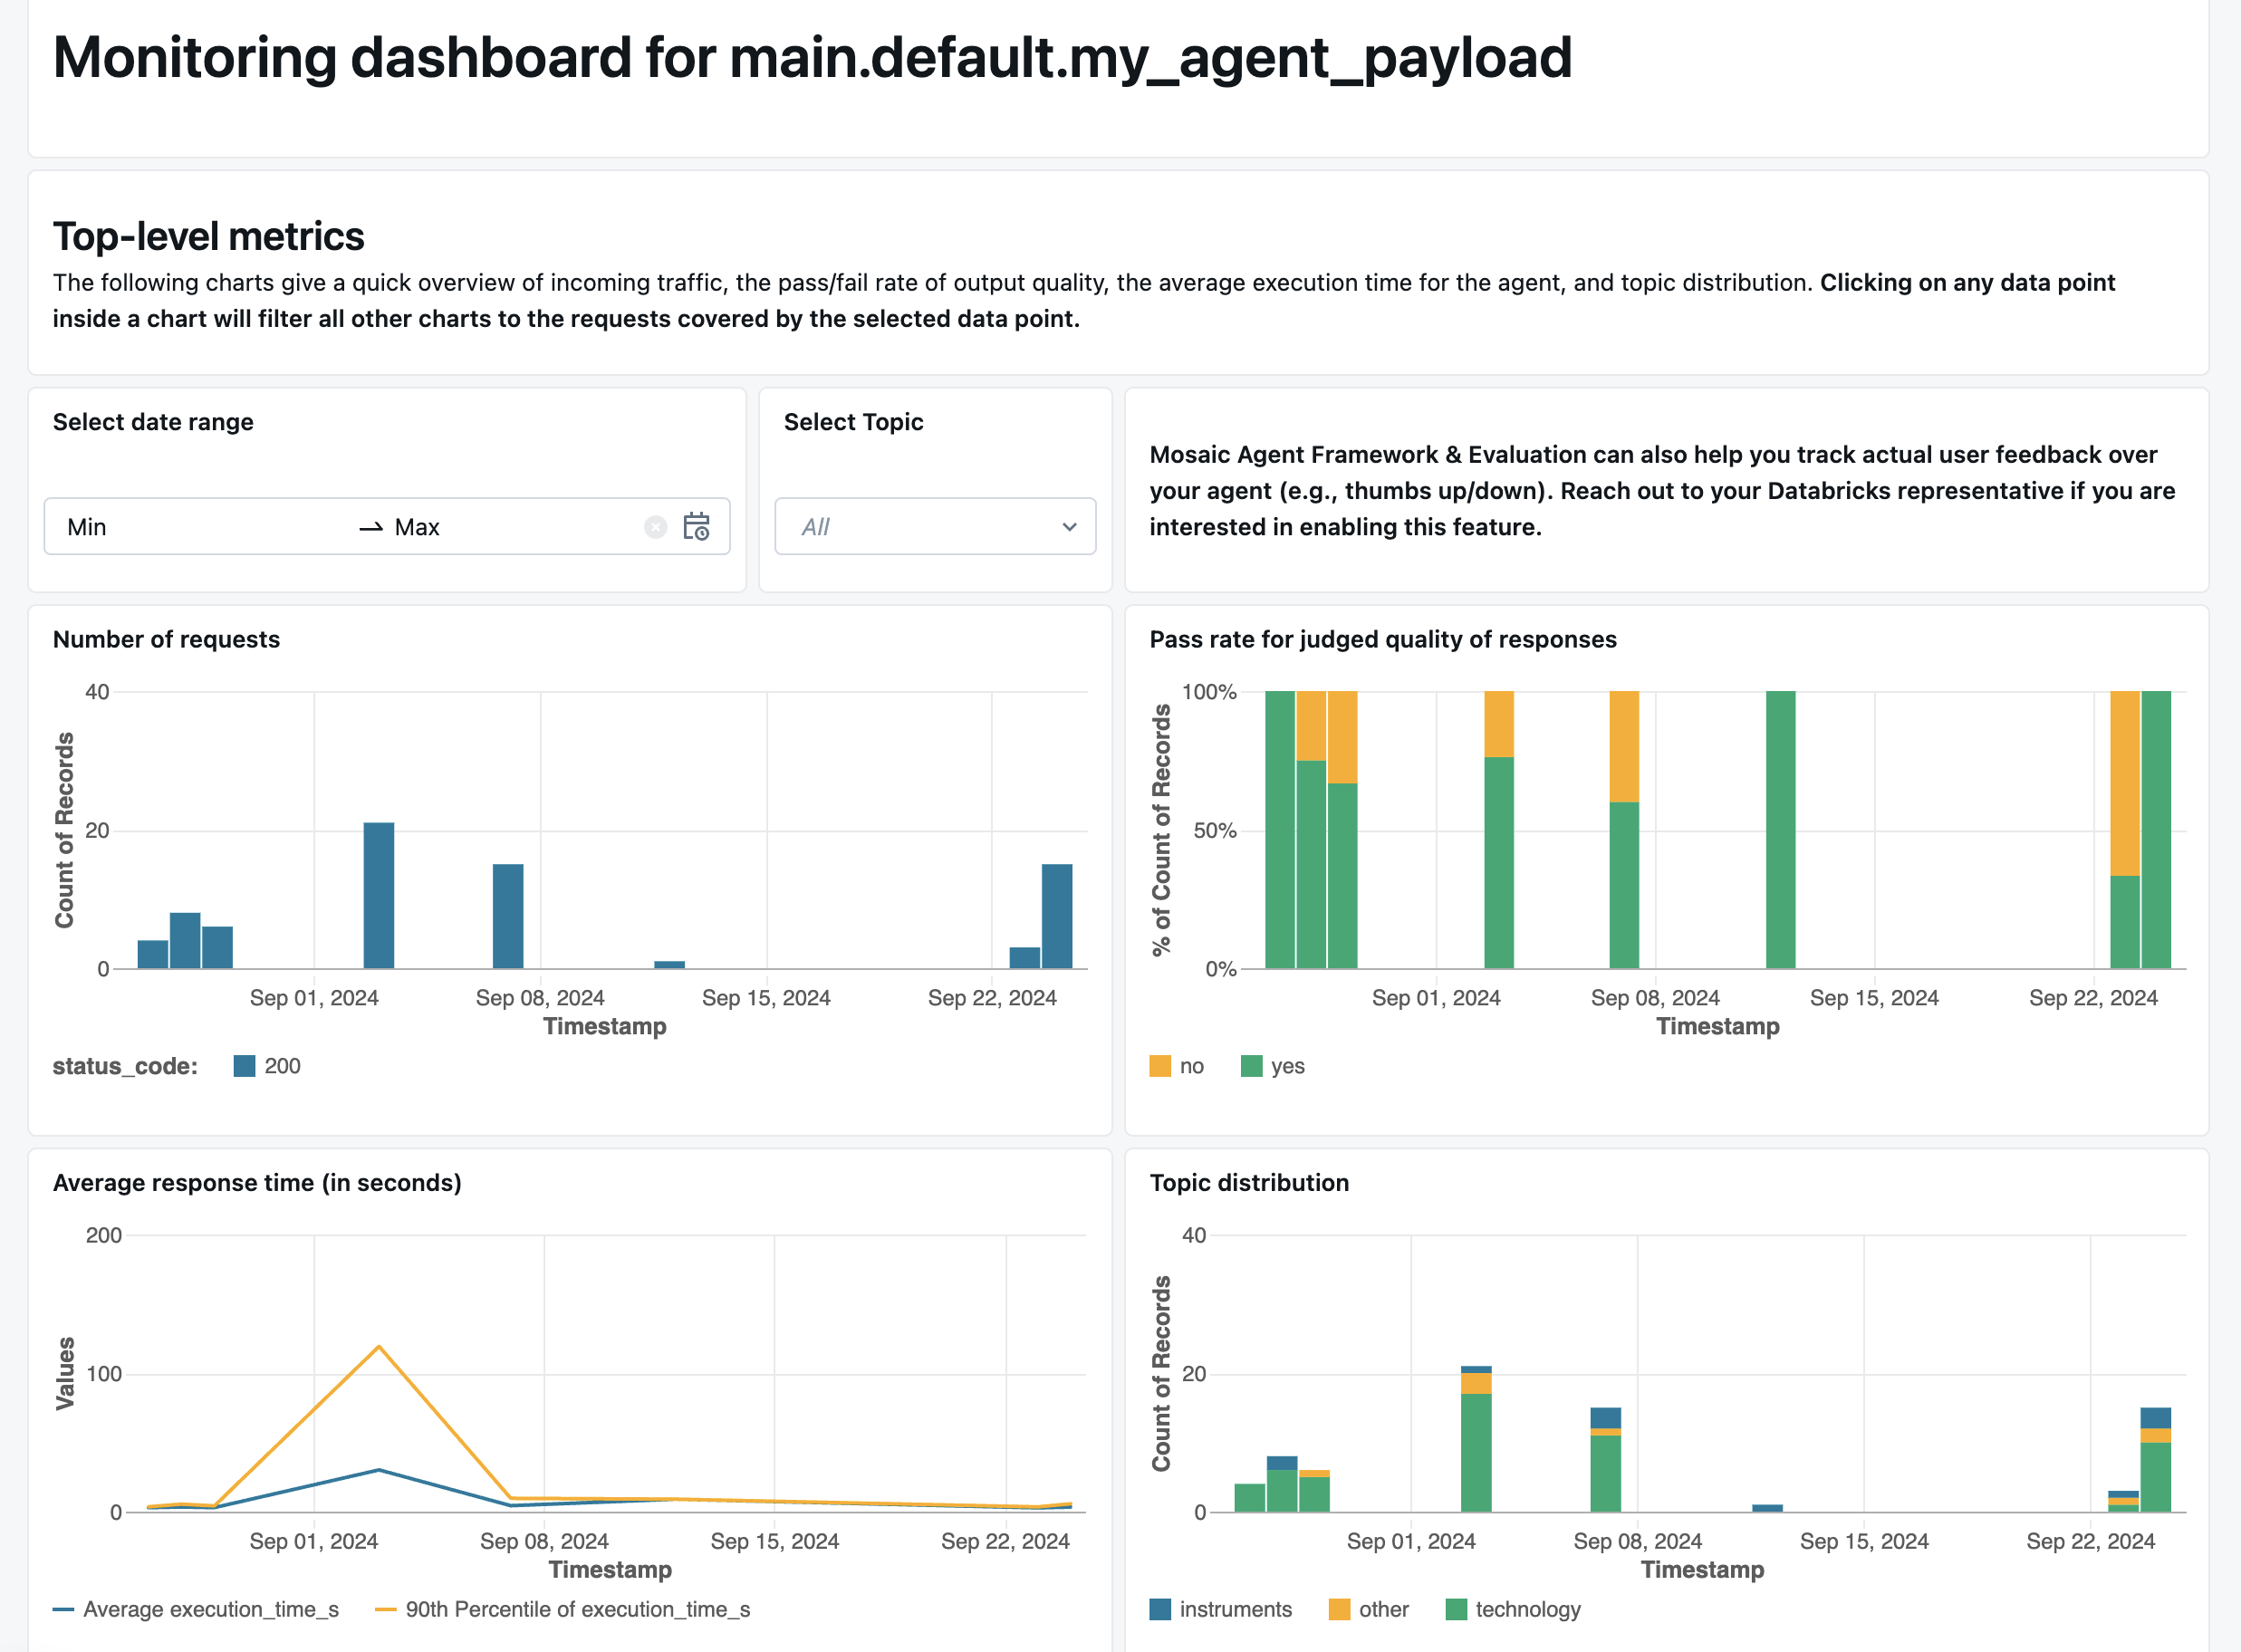
Online monitoring is a crucial aspect of ensuring that your agent is working as intended with real-world requests. Using the notebook provided below, you can run Agent Evaluation continuously on the requests served through an agent-serving endpoint. The notebook generates a dashboard that displays quality metrics as well as user feedback (thumbs up 👍 or thumbs down 👎) for your agent’s outputs on production requests. This feedback can arrive through the review app from stakeholders, or the feedback API on production endpoints that allows you to capture end-user reactions. The dashboard enables you to slice the metrics by different dimensions, including by time, user feedback, pass/fail status, and topic of the input request (for example, to understand whether specific topics are correlated with lower-quality outputs). Additionally, you can dive deeper into individual requests with low-quality responses to further debug them. All artifacts, such as the dashboard, are fully customizable.
Requirements
- Azure AI-powered AI assistive features must be enabled for your workspace.
- Inference tables must be enabled on the endpoint that is serving the agent.
Continuously process production traffic through Agent Evaluation
The following example notebook illustrates how to run Agent Evaluation on the request logs from an agent serving endpoint. To run the notebook once, fill in the required parameters at the top and click Run all. To continuously monitor production traffic, click Schedule to create a job to run the notebook periodically. You must provide the following values:
- The name of your deployed agent’s serving endpoint.
- A sample rate between 0.0 and 1.0 to sample requests. Use a lower rate for endpoints with high amounts of traffic.
- (Optional) A workspace folder to store generated artifacts (such as dashboards). The default is the home folder.
- (Optional) A list of topics to categorize the input requests. The default is a list consisting of a single catch-all topic.
The notebook requires either serverless compute or a cluster running Databricks Runtime 15.2 or above. When continuously monitoring production traffic on endpoints with a large numbe of requests, we recommend setting a more frequent schedule. For instance, an hourly schedule would work well for an endpoint with more than 10,000 requests per hour and a 10% sample rate.
Run Agent Evaluation on production traffic notebook
Create alerts on evaluation metrics
After you schedule the notebook to run periodically, you can add alerts to be notified when quality metrics dip lower than expected. These alerts are created and used the same way as other Databricks SQL alerts. First, create a Databricks SQL query on the evaluation requests log table generated by the example notebook. The following code shows an example query over the evaluation requests table, filtering requests from the past hour:
SELECT
  `date`,
  AVG(pass_indicator) as avg_pass_rate
FROM (
  SELECT
    *,
    CASE
      WHEN `response/overall_assessment/rating` = 'yes' THEN 1
      WHEN `response/overall_assessment/rating` = 'no' THEN 0
      ELSE NULL
    END AS pass_indicator
  -- The eval requests log table is generated by the example notebook
  FROM {eval_requests_log_table_name}
  WHERE `date` >= CURRENT_TIMESTAMP() - INTERVAL 1 DAY
)
GROUP BY ALL
Then, create a Databricks SQL alert to evaluate the query at a desired frequency, and send a notification if the alert is triggered. The following image shows an example configuration to send an alert when the overall pass rate falls below 80%.
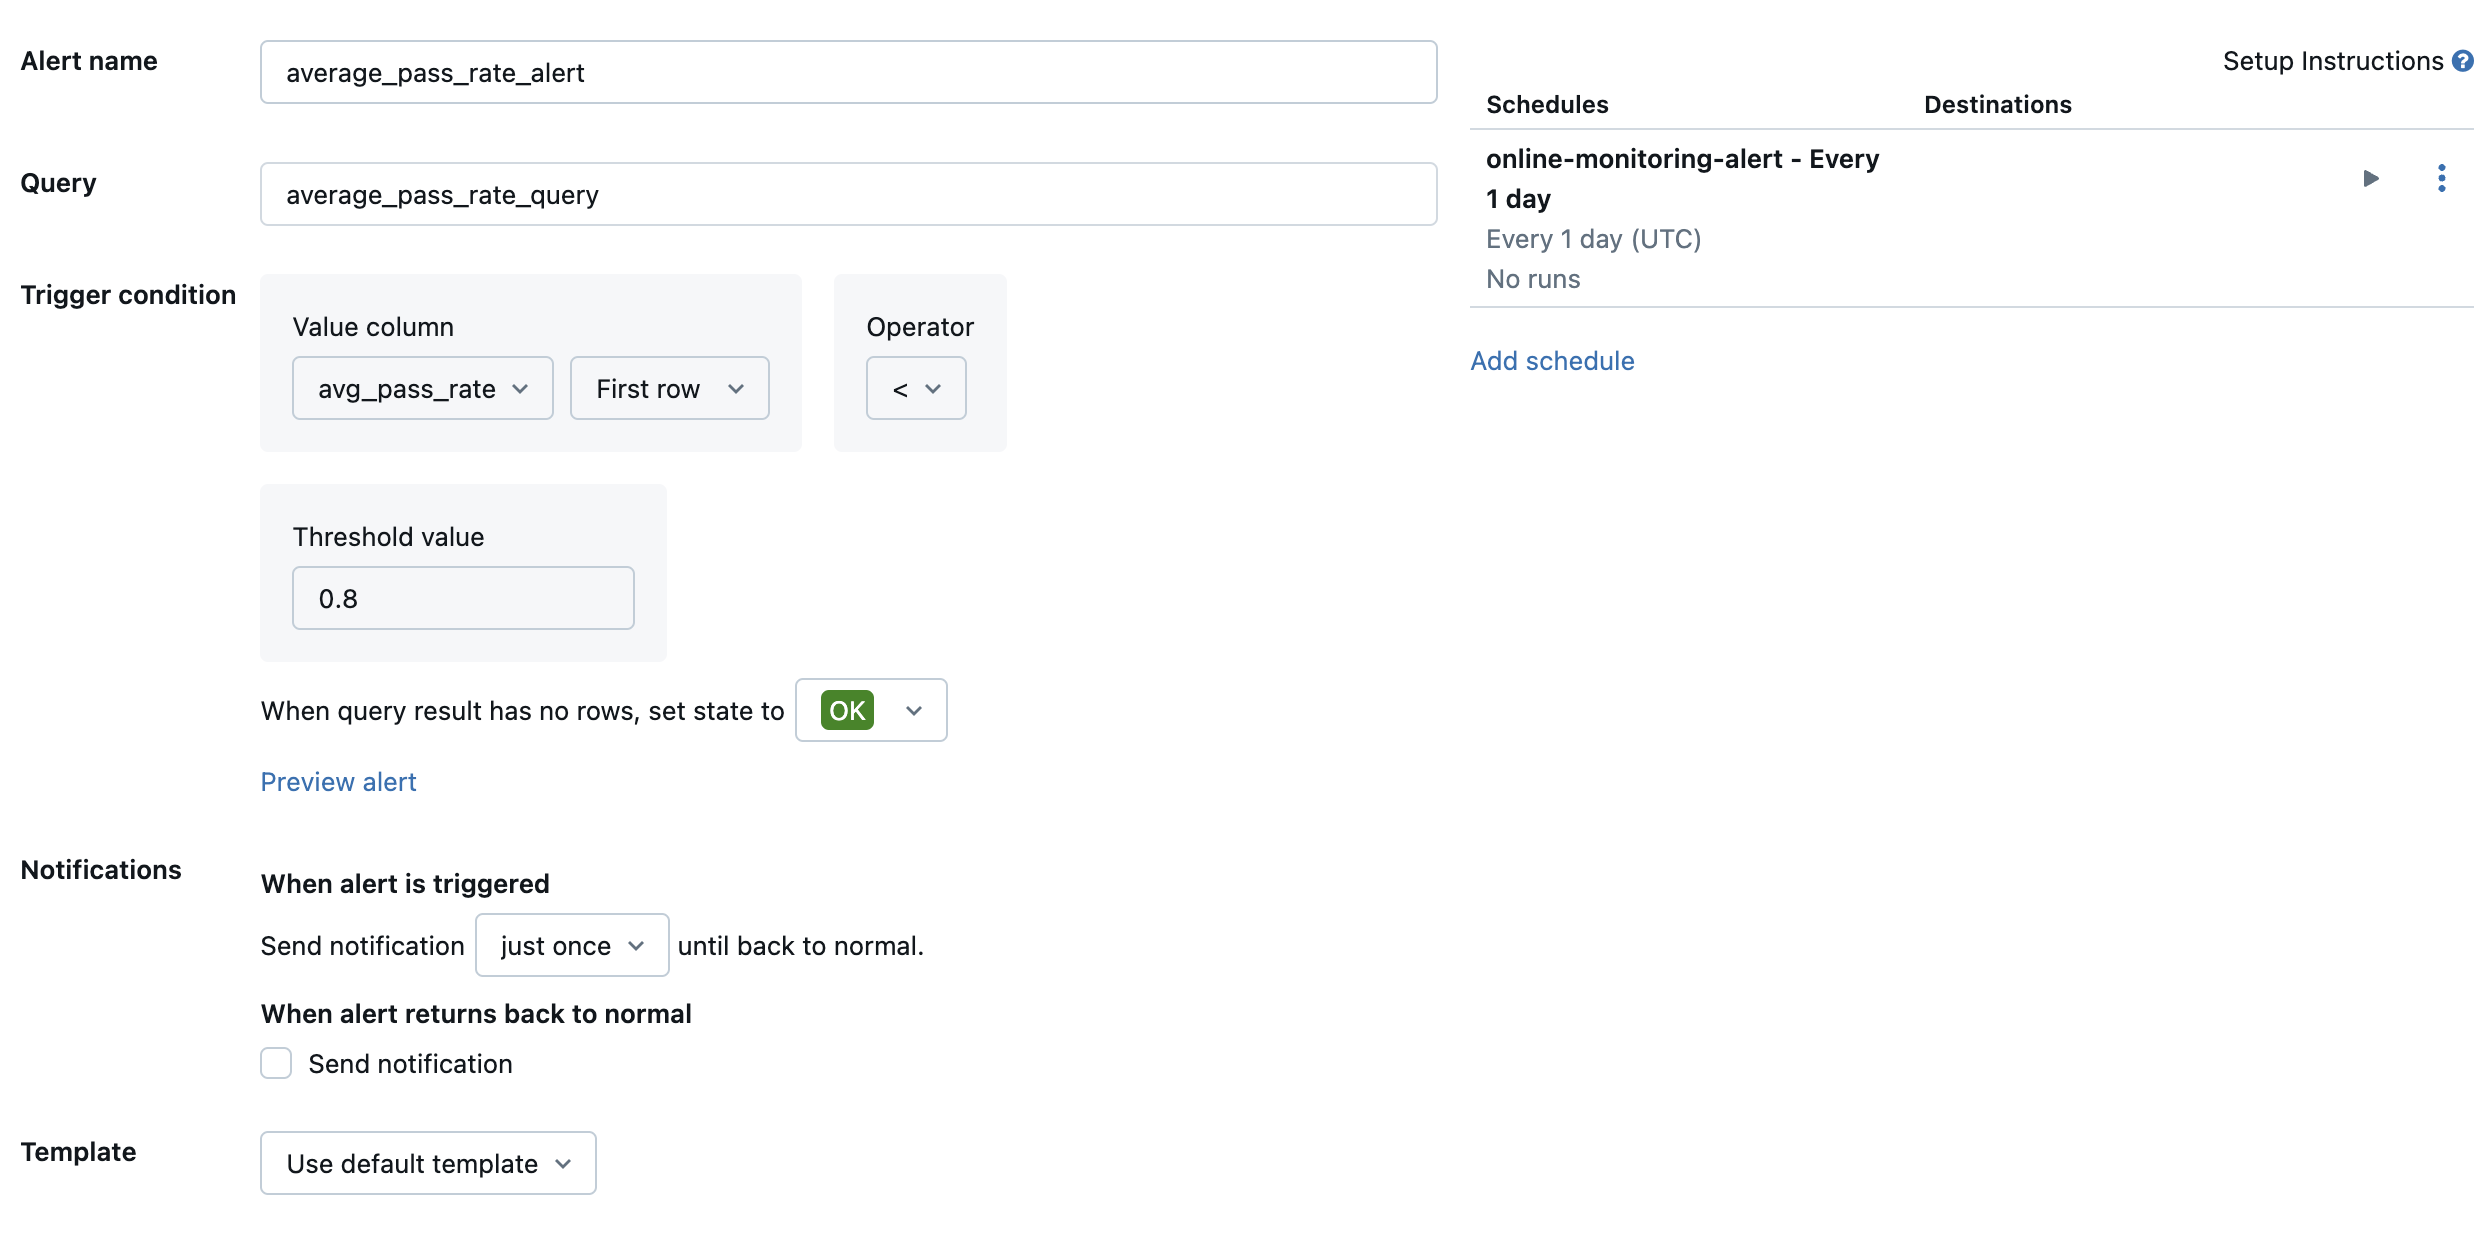
By default, an email notification is sent. You can also set up a webhook or send notifications to other applications such as Slack or PagerDuty.
Add selected production logs to the review app for human review
As users provide feedback on your requests, you may want to request subject matter experts to review requests with negative feedback (requests with thumbs down on the response or retrievals). To do so, you add specific logs to the review app to request expert review.
The following code shows an example query over the assessment log table to retrieve the most recent human assessment per request ID and source ID:
with ranked_logs as (
  select
      `timestamp`,
      request_id,
      source.id as source_id,
      text_assessment.ratings["answer_correct"]["value"] as text_rating,
      retrieval_assessment.ratings["answer_correct"]["value"] as retrieval_rating,
      retrieval_assessment.position as retrieval_position,
      row_number() over (
        partition by request_id, source.id, retrieval_assessment.position order by `timestamp` desc
      ) as rank
  from {assessment_log_table_name}
)
select
    request_id,
    source_id,
    text_rating,
    retrieval_rating
from ranked_logs
where rank = 1
order by `timestamp` desc
In the following code, replace ... in the line human_ratings_query = "..." with a query similar to the one above. The following code then extracts requests with negative feedback and adds them to the review app:
from databricks import agents

human_ratings_query = "..."
human_ratings_df = spark.sql(human_ratings_query).toPandas()

# Filter out the positive ratings, leaving only negative and "IDK" ratings
negative_ratings_df = human_ratings_df[
  (human_ratings_df["text_rating"] != "positive") | (human_ratings_df["retrieval_rating"] != "positive")
]
negative_ratings_request_ids = negative_ratings_df["request_id"].drop_duplicates().to_list()

agents.enable_trace_reviews(
  model_name=YOUR_MODEL_NAME,
  request_ids=negative_ratings_request_ids,
)
For more details on the review app, see Get feedback about the quality of an agentic application.