Create and share visualizations
Applies to: ✅ SQL database in Microsoft Fabric
In this tutorial, learn how to use multiple tools to analyze data stored in your SQL database in Fabric or the SQL analytics endpoint.
Prerequisites
- Complete all the previous steps in this tutorial.
Find the connection strings to the SQL database
To get your server and database name, open your SQL database in Fabric portal view and select the Settings button in the icon bar.
Note
The SQL database in Fabric and its SQL analytics endpoint have different connection strings. For this tutorial step, connect to the SQL database. You'll use the SQL analytics endpoint in the next tutorial step.

Select Connection Strings and you'll see a long string that starts with Data Source... From there, select the text between the characters tcp: through the characters ,1433. Ensure that you select the entire set of characters there and nothing more for the server name.
For the database name, select all the characters between the characters Initial Catalog= and ;MultipleActiveResultSets.
You can now use these SQL strings in your connection area for tools such as Power BI or SQL Server Management Studio. For Visual Studio Code with the mssql extension, you can paste the entire connection string in the first text box where you make a database connection, so you don't have to select only the server and database names.
Power BI visualization creation
As you work with the SQL analytics endpoint, it creates a Data model of the assets. This is an abstracted view of your data and how it's displayed and the relationship between entities. Some of the defaults the system takes might not be as you desire, so you'll now change one portion of the data model for this SQL analytics endpoint to have a specific outcome.
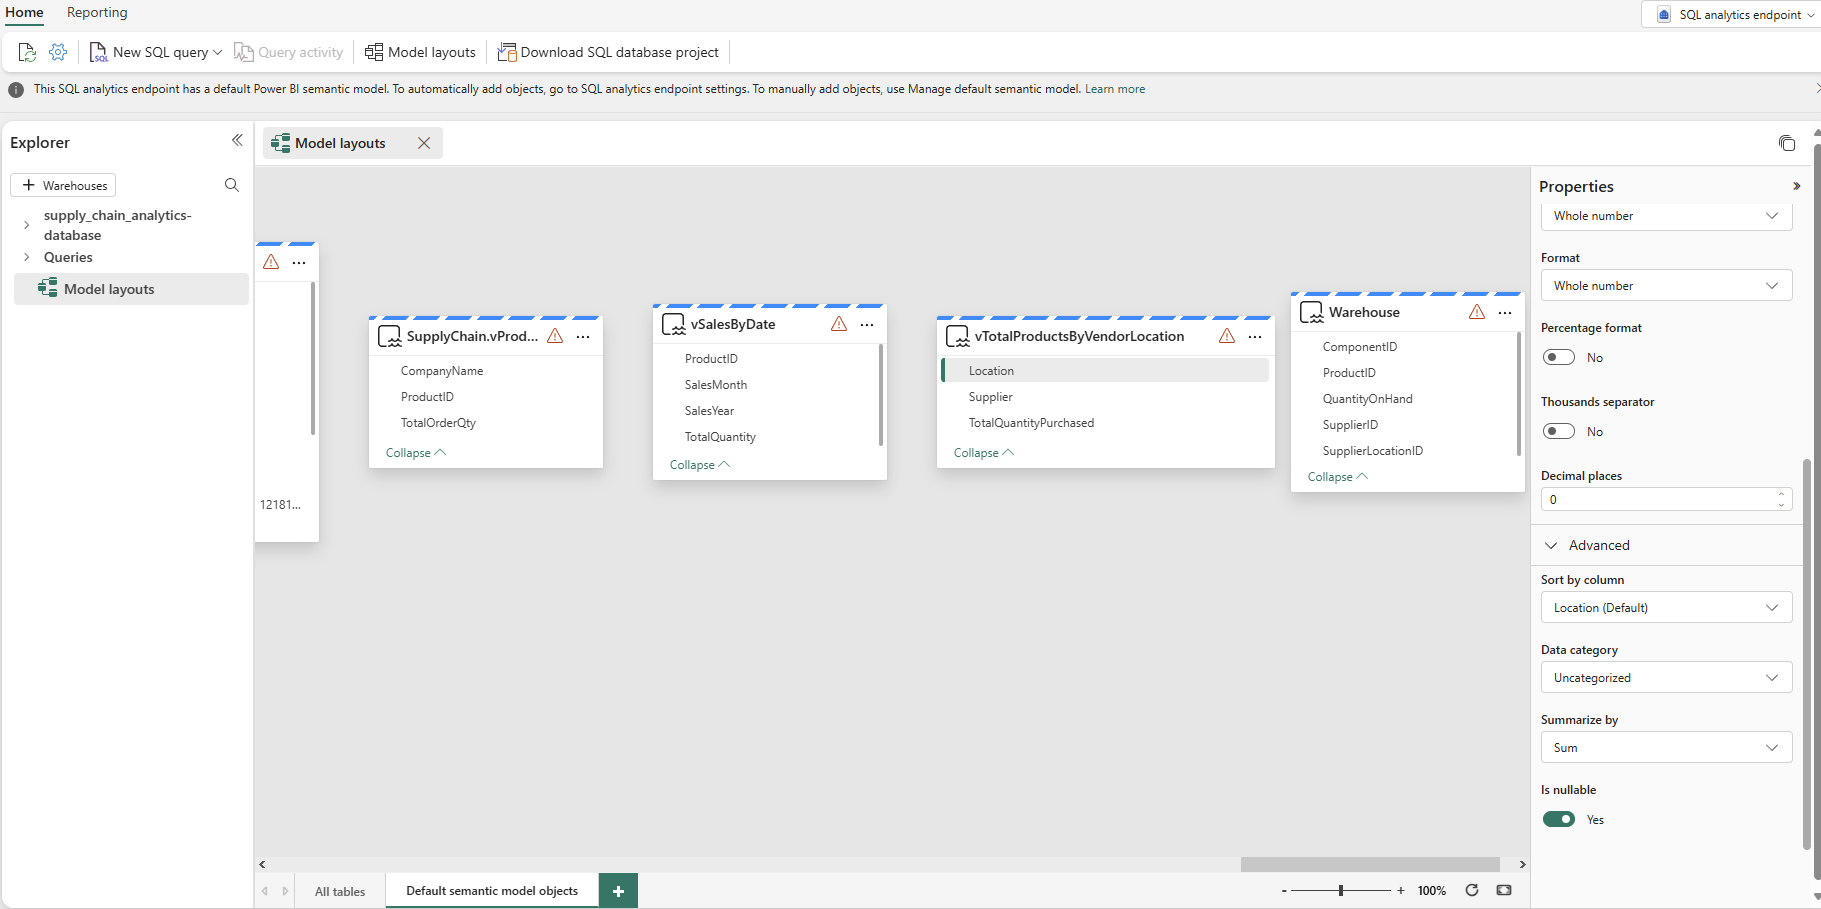
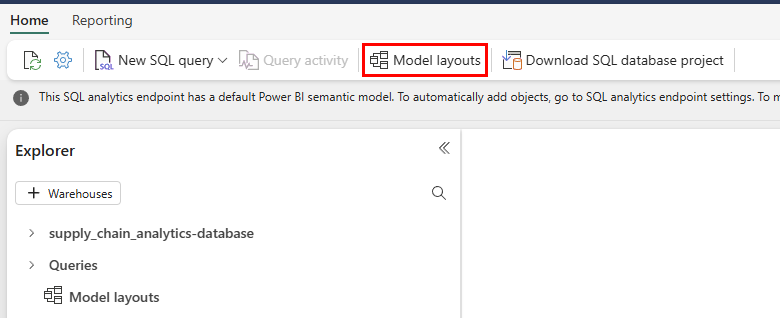
In your SQL analytics endpoint view, select the Model layouts button in the ribbon.
From the resulting view, zoom in and scroll over until you see the
vTotalProductsByVendorLocationobject. Select it.In the properties, select the Location field, and expand the Advanced properties selection. You might need to scroll to find it. Set the value of Summarize by to None. This ensures that when the field is used, it's a discrete number, not a mathematical summarization of that number.
Create a report
Inside the SQL analytics endpoint view, you have a menu option for Reporting. You'll now create a report based on the views you created in the SQL analytics endpoint in a previous tutorial step.
Select the Reporting button in the menu bar and then the New report button in the ribbon.
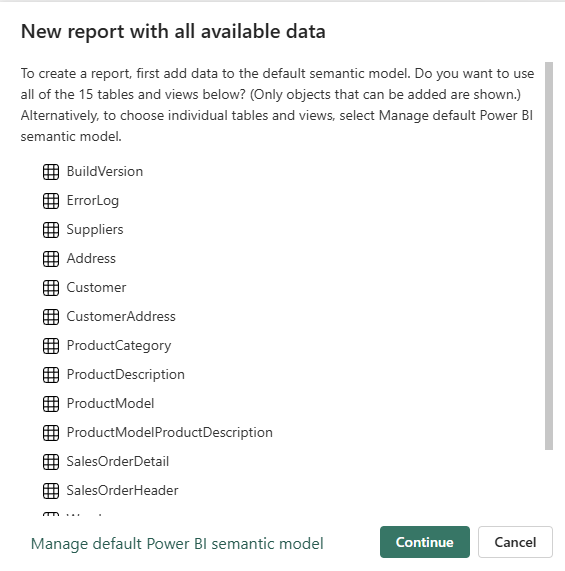
From the New report with all available data that appears, select the Continue button.
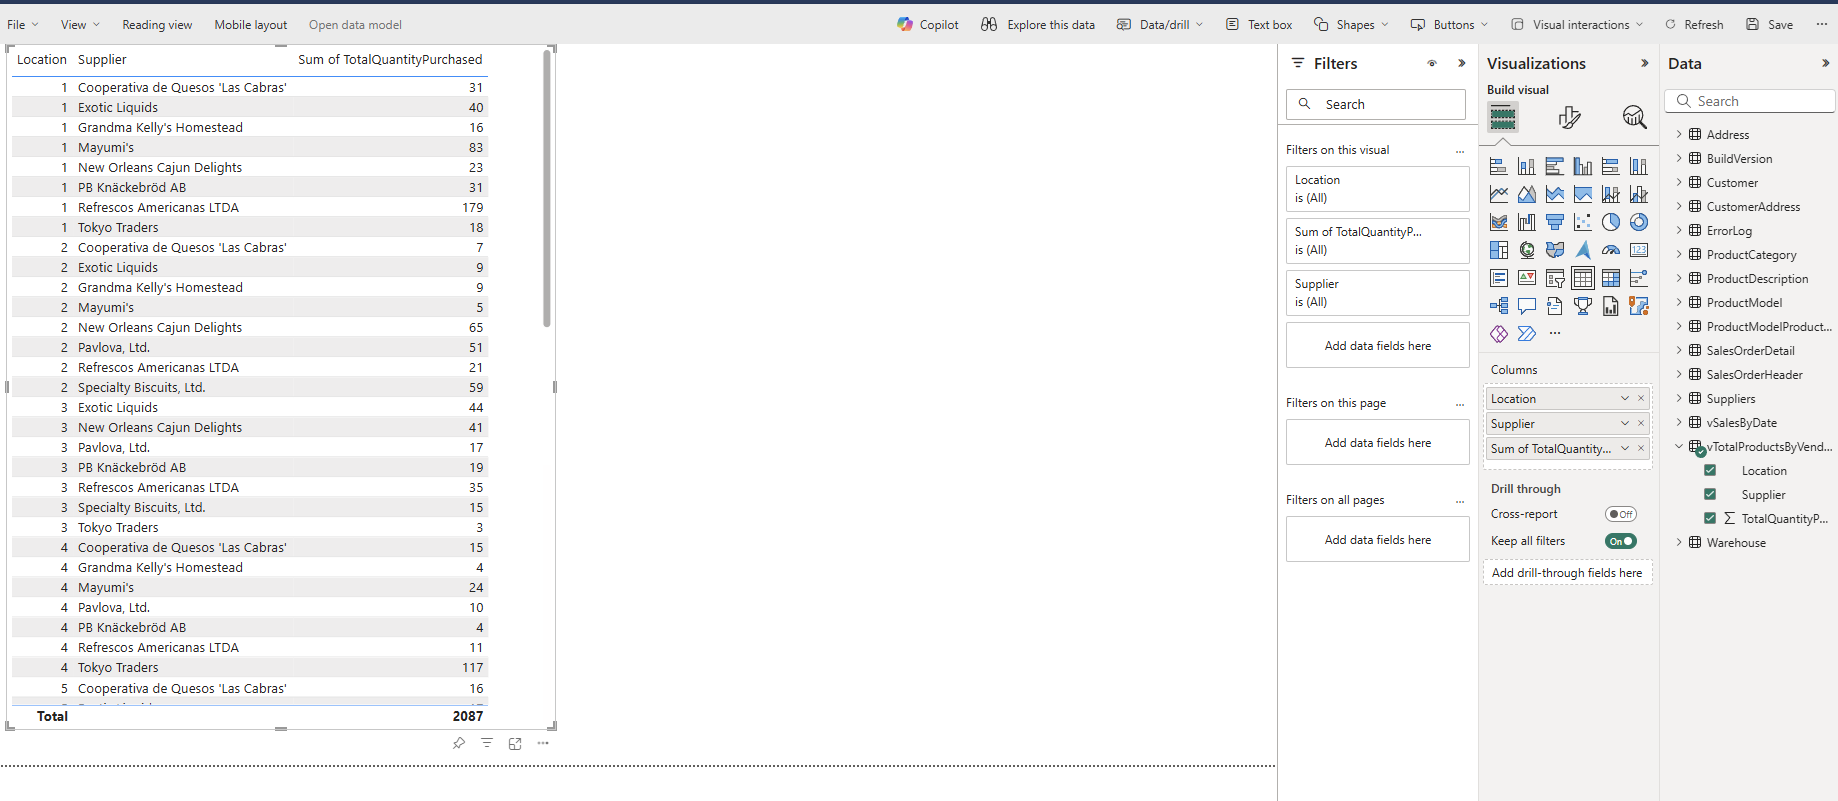
The Power BI canvas appears, and you're presented with the option to use the Copilot to create your report. Feel free to explore what Copilot can come up with. For the rest of this tutorial, we'll create a new report with objects from earlier steps.
Expand the
vTotalProductsByVendordata object. Select each of the fields you see there. The report takes a moment to gather the results to a text view. You can size this text box if desired.Select in a blank area of the report canvas, and then select Location in the Data fields area.
Select a value in the box you just created – notice how the first selection of values follows the selection you make in the second box. Select that same value again to clear the selection.
Select in a blank area of the reporting canvas, and then select the Supplier field.
Once again, you can select the name of a supplier and the first selection shows the results of just that supplier.
Save the Power BI item for sharing
You can save and share your report with other people in your organization.
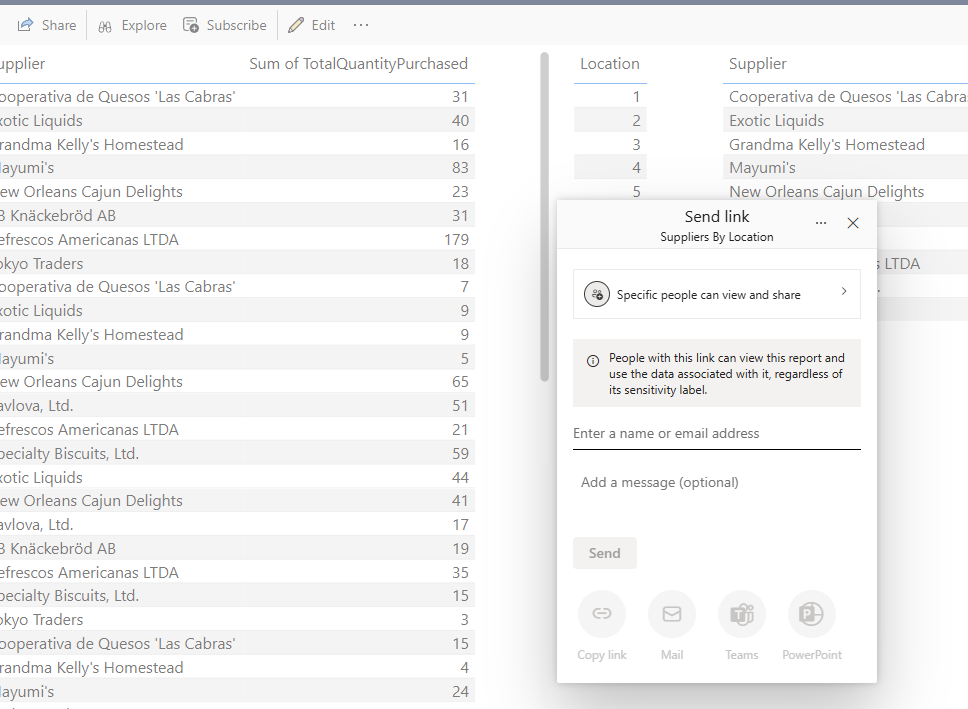
Select the Save button in the icon box and name the report suppliers_by_location_report, and ensure you select the correct Workspace for this tutorial.
Select the Share button in the icon bar to share the report with people in your organization who have access to the proper data elements.
