Query the database and review Copilot features
Applies to: ✅ SQL database in Microsoft Fabric
You can use Transact-SQL queries in multiple tools, such as Visual Studio Code, SQL Server Management Studio (SSMS), and other tools that connect over the standard Tabular Data Stream (TDS) protocol.
Prerequisites
- Complete all the previous steps in this tutorial.
Connect
You can connect to the SQL database using the web-based editor in the Fabric portal.
Open your Workspace and locate the SQL database in Fabric that you created earlier in this tutorial. Either select the name of the database or select the ellipses next to the database name and select Open.
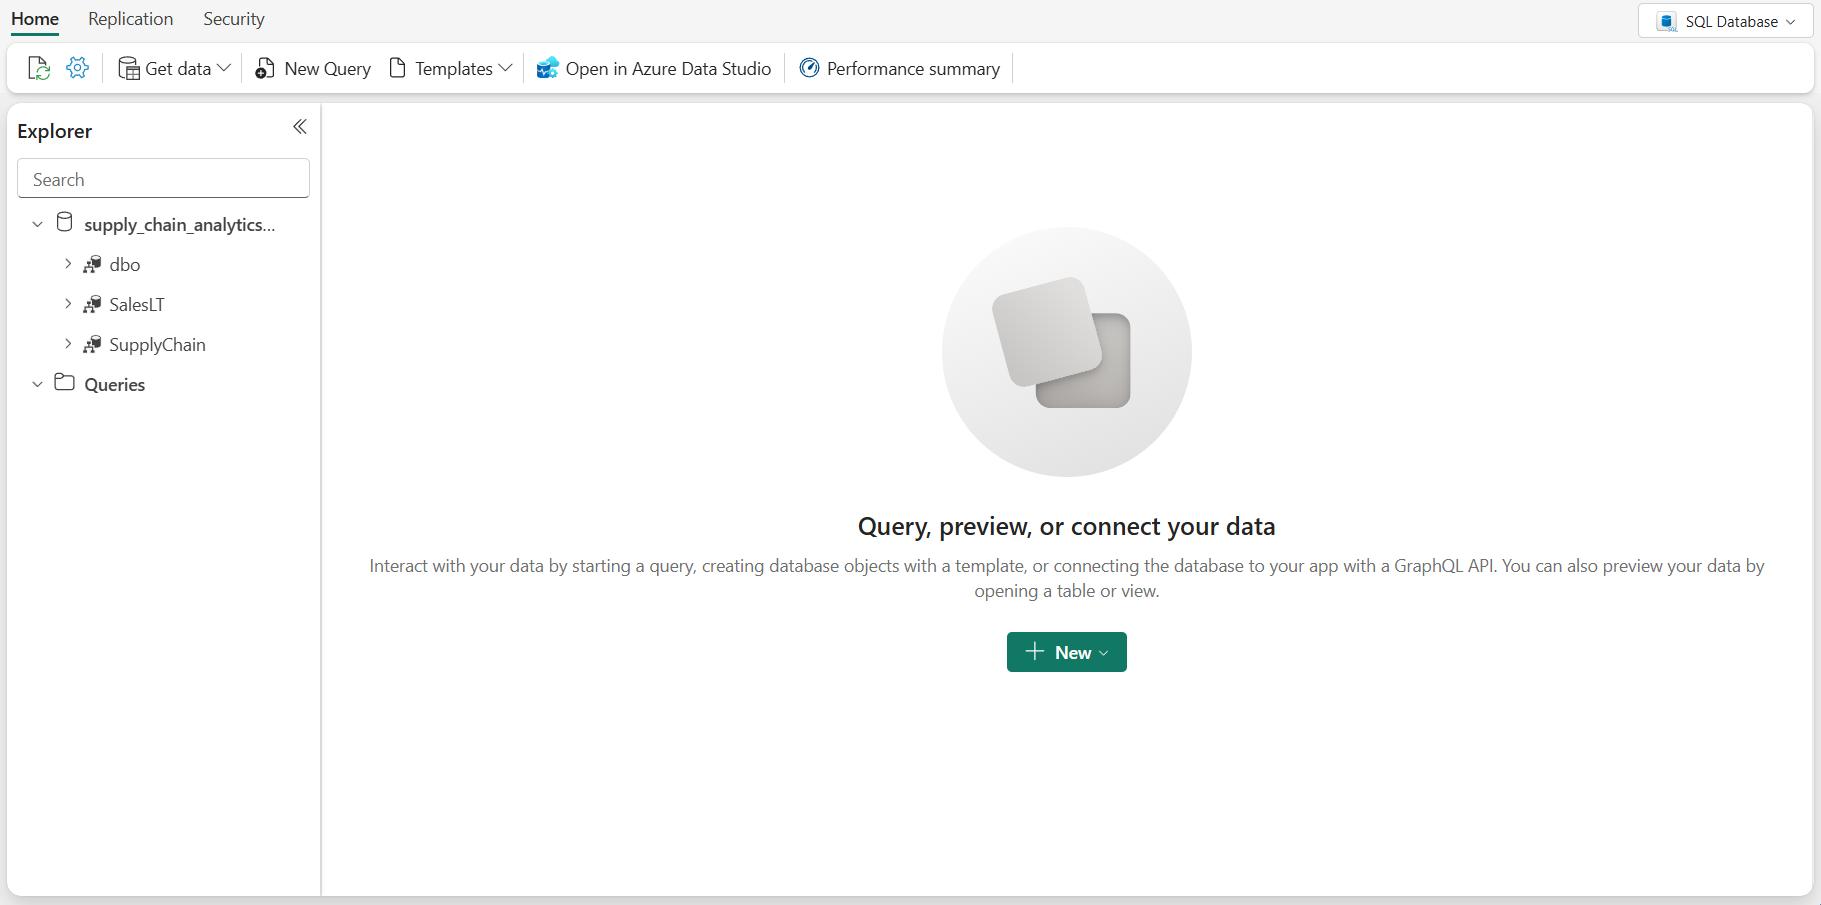
The web-based editor for SQL database in Fabric provides a foundational object explorer and query execution interface. The integrated Explorer menu lists all database objects.
Transact-SQL queries
You can type Transact-SQL (T-SQL) statements in a query window.
In ribbon of the database in the Fabric portal, select the New Query button.

Copy the following T-SQL script and paste it in the query window. This sample script performs a simple
TOP 10query, and creates a view based on a simple analytical T-SQL query. The new viewSupplyChain.vProductsbySupplierswill be used later in this tutorial.-- Show the top 10 selling items SELECT TOP 10 [P].[ProductID], [P].[Name], SUM([SOD].[OrderQty]) AS TotalQuantitySold FROM [SalesLT].[Product] AS P INNER JOIN [SalesLT].[SalesOrderDetail] AS SOD ON [P].[ProductID] = [SOD].[ProductID] GROUP BY [P].[ProductID], [P].[Name] ORDER BY TotalQuantitySold DESC; GO /* Create View that will be used in the SQL GraphQL Endpoint */ CREATE VIEW SupplyChain.vProductsbySuppliers AS SELECT COUNT(a.ProductID) AS ProductCount , a.SupplierLocationID , b.CompanyName FROM SupplyChain.Warehouse AS a INNER JOIN dbo.Suppliers AS b ON a.SupplierID = b.SupplierID GROUP BY a.SupplierLocationID, b.CompanyName; GOSelect the Run button in the toolbar to execute the T-SQL query.
You can also highlight sections of the query to run just that portion of your code.
The query is automatically saved with the name SQL query 1 under the Queries item under the Object view. You can select the ellipses (
...) next to the name to duplicate, rename, or delete it.
Copilot for SQL database
With Copilot for SQL database, you can start writing T-SQL in the SQL query editor and Copilot will automatically generate a code suggestion to help complete your query. The Tab key accepts the code suggestion or keeps typing to ignore the suggestion.
The query editor panel includes Copilot for SQL database.
Note
Copilot for SQL database does not use the data in tables to generate T-SQL suggestions, on the names of database objects such as table and view names, column names, primary key, and foreign key metadata to generate T-SQL code.
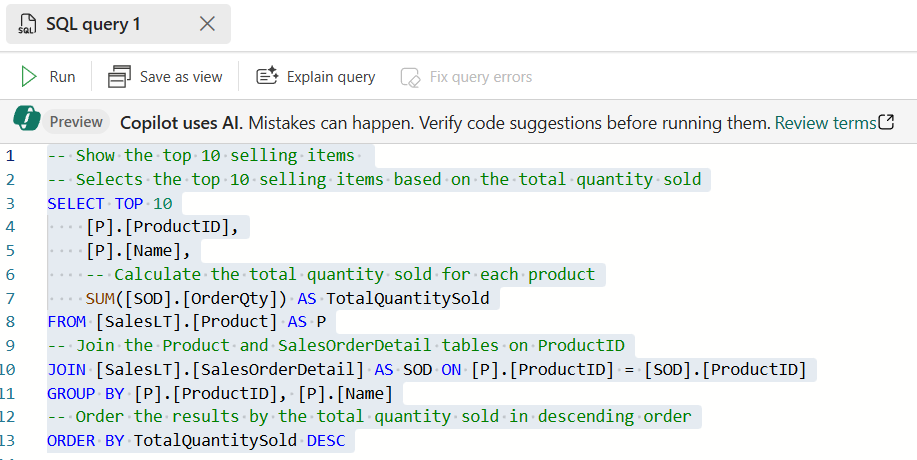
You also have access to various Quick actions. In the ribbon of the SQL query editor, the Fix and Explain options are quick actions. Highlight a SQL query of your choice, then select one of the quick action buttons to perform the selected action on your query.
Highlight the code you just pasted in your query window.
Press the Explain query button in the query window ribbon.
Copilot adds in comments that help explain what each step of the code is doing.
Copilot can fix errors in your code as error messages arise. Error scenarios can include incorrect or unsupported T-SQL code, incorrect spellings, and more. Copilot will also provide comments that explain the changes and suggest SQL best practices. You can also get a natural language explanation of your SQL query and database schema in comments format.
There's also a chat pane where you can ask questions to Copilot through natural language. Copilot responds with a generated SQL query or natural language based on the question asked.
There are other Copilot features you can experiment with, such as Natural Language to SQL and Document-based Q&A. Copilot also helps find documentation related to your request. For more information, see Copilot for SQL database in Microsoft Fabric (preview).
Performance monitoring in SQL database in Fabric
As your queries run in your SQL database in Fabric, the system collects performance metrics to display in the Performance Dashboard. You can use the Performance Dashboard to view database performance metrics, to identify performance bottlenecks, and find solutions to performance issues.
In the Fabric portal, there are two ways to launch the Performance Dashboard on your SQL database:
- On the Home toolbar in the Query with the SQL query editor, select Performance summary.
- Right-click on the context button (the three dots) in the item view, then select Open performance summary.
Performance alerts
Another performance feature in SQL database in Fabric is Alerts. These are automatically generated alerts with preset criteria provide Ongoing Alerts, which are raised when the database is facing a problem. This alert is represented by a horizontal Notification bar. Another set of alerts are the Pending Alerts which stored in the system, indicating that analysis is needed for a database parameter reaching a critical state.
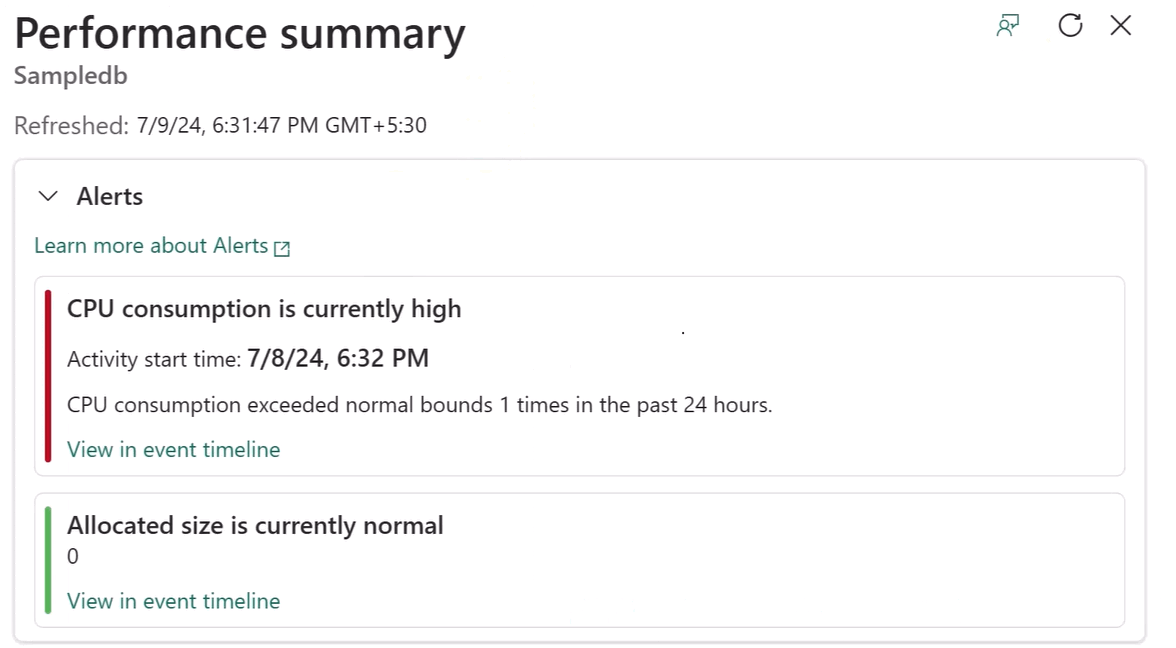
Once you select the link for an alert, the Performance Summary provides a summary of alerts and recent metrics of the database. From here, you can drill into the event timeline for more information.
When the database reaches a critical state of CPU consumption (or any other factor which raises an alert), you can see Unhealthy points marked on the CPU consumption tab's graph, marking points where the CPU consumption crosses the threshold value. The time interval is configurable and defaults to 24 hours.
In the Queries tab, queries can be opened to troubleshoot the query details. Each query includes details including an execution history and query preview. You can open the T-SQL query text in the editor, or in SQL Server Management Studio, for troubleshooting.
Another performance feature of SQL database in Fabric is automatic tuning. Automatic tuning is a continuous monitoring and analysis process that learns about the characteristics of your workload and identifies potential issues and improvements.
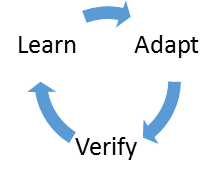
This process enables the database to dynamically adapt to your workload by finding what nonclustered indexes and plans might improve the performance of your workloads. Based on these findings, automatic tuning applies tuning actions that improve the performance of your workload.
In addition, automatic tuning continuously monitors the performance of the database after implementing any changes to ensure that it improves performance of your workload. Any action that didn't improve performance is automatically reverted. This verification process is a key feature that ensures any change made by automatic tuning doesn't decrease the overall performance of your workload.
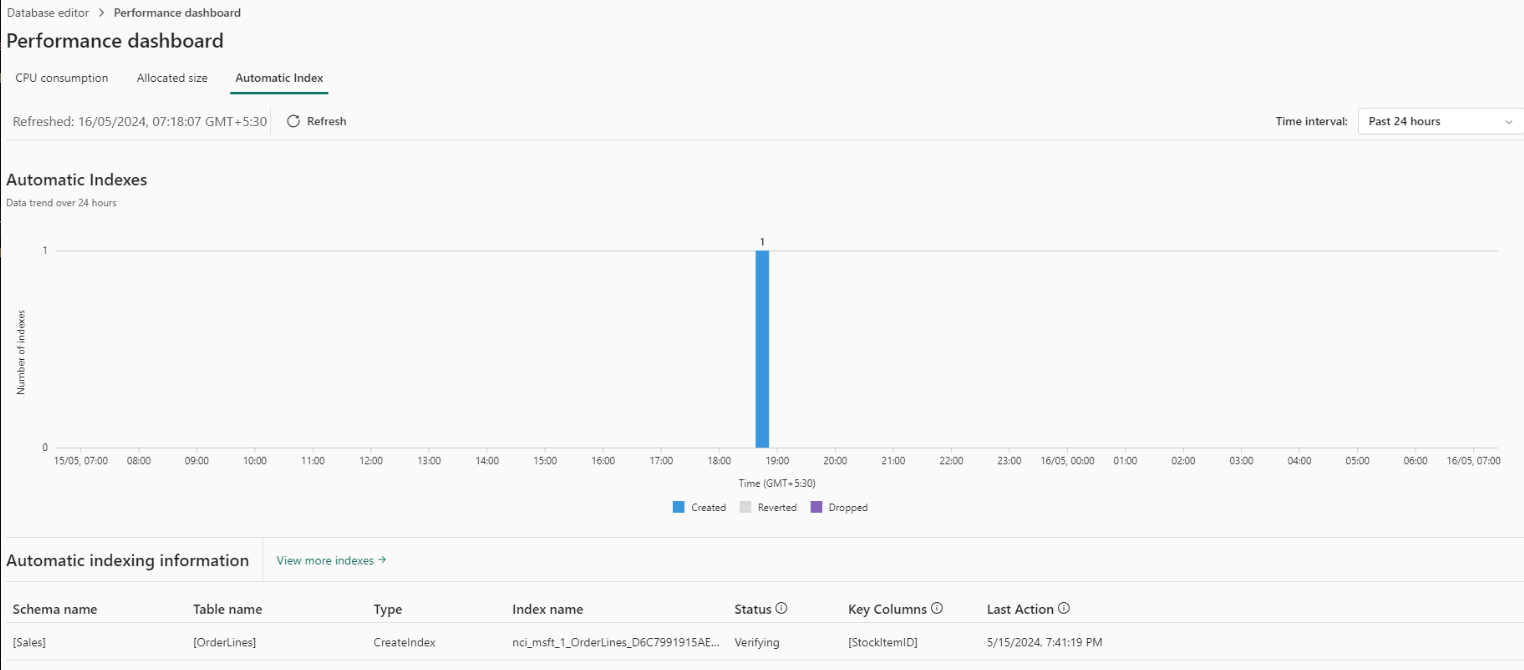
Automatic indexing in Azure SQL Database and Fabric SQL database is part of this tuning and automates index management, enhancing query performance and data retrieval speed. It adapts by identifying and testing potential indexes based on column usage. The feature improves overall database performance and optimizes resources by removing unused indexes.
In the Fabric portal, the Automatic Index tab shows a history and status of automatically created indexes:
For more information, see Performance Dashboard for SQL database in Microsoft Fabric.
Backups in SQL database in Fabric
SQL database in Fabric automatically takes backups for you, and you can see these backups in the properties that you access through the database view of the Fabric portal.
Open your database view in the Fabric portal.
Select the Settings icon in the toolbar.
Select the Restore points page. This view shows the recent point in time backups that have been taken on your database.
For more information about backups in Fabric SQL database, see Automatic backups in SQL database in Microsoft Fabric and Restore from a backup in SQL database in Microsoft Fabric.
Security in SQL database in Fabric
Security in SQL database in Fabric involves two authentication and access systems: Microsoft Fabric and database security. The complete security posture is a "most permissive" overlay of these systems, so it's best practice to give just connection access to Microsoft Fabric principals, and then manage the security of the database securables for more granularity.
You'll now grant access to another account in your organization and then control their database securables using Schemas.
From your Fabric Workspace you created for this tutorial, select the context menu (
...) of the SQL database, then select Share from the menu.Enter a contact name from your organization to receive the sharing invitation notification.
Select Grant.
You don't need to grant any further permissions in this area – sharing the database to the account gives the sharing contact access to connect.
Open the SQL database by selecting on it in the workspace view.
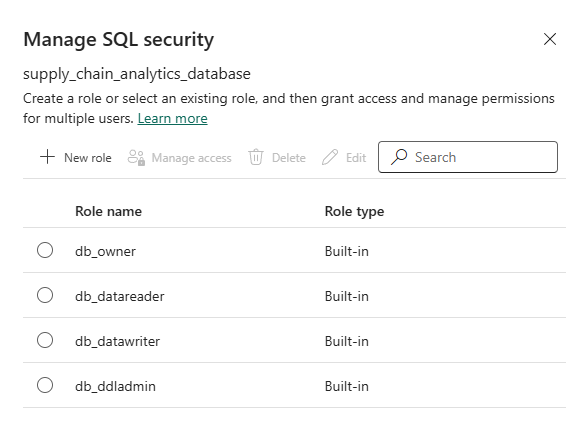
Select Security in the menu bar of the database view. Select Manage SQL security in the ribbon.
In this panel, you can select a current database role to add accounts to it. Select the + New role item.
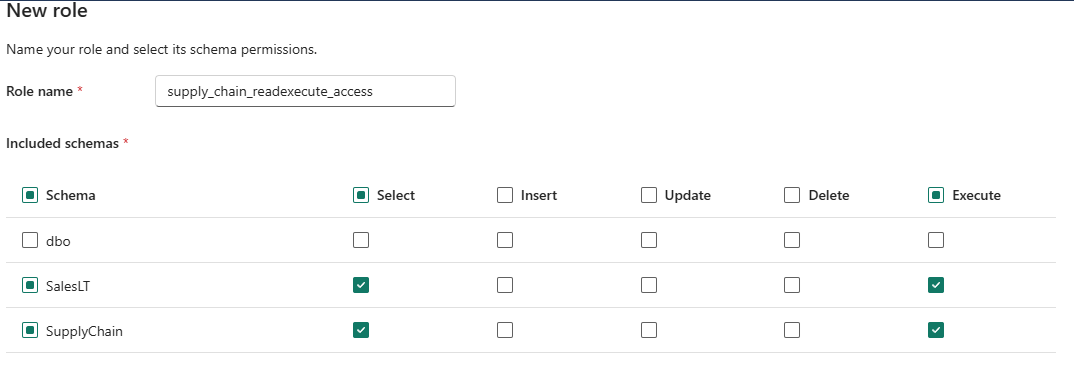
Name the role supply_chain_readexecute_access and then select the
SalesLTandSupplyChainschemas. De-select all checkboxes except Select and Execute.Select Save.
In the Manage SQL security panel, select the radio-box next to the new role, and select Manage access in the menu.
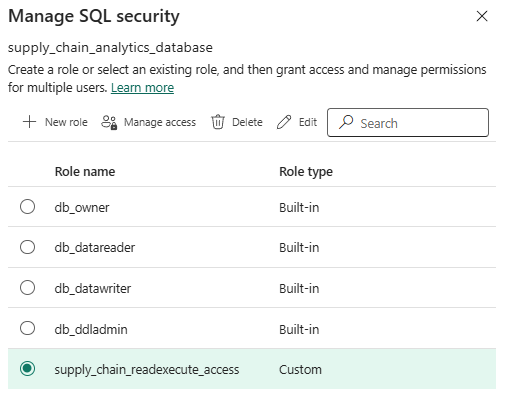
Enter the name of the account in your organization you shared the database to and select the Add button, and then select Save.
You can allow the account to view data and run stored procedures in the database with the combination of: the Share action, and granting the role both SELECT and EXECUTE permissions on the two schemas.
You also have GRANT, DENY, and other Data Control Language (DCL) operations for a finer-grained security model for your SQL database in Fabric data.
For more information about sharing, see Share your SQL database and manage permissions and Share items in Microsoft Fabric.

